SunTrust 2008 Annual Report Download - page 72
Download and view the complete annual report
Please find page 72 of the 2008 SunTrust annual report below. You can navigate through the pages in the report by either clicking on the pages listed below, or by using the keyword search tool below to find specific information within the annual report.-
 1
1 -
2
-
3
-
4
-
5
-
6
-
7
-
8
-
9
-
10
-
11
-
12
-
13
-
14
-
15
-
16
-
17
-
18
-
19
-
20
-
21
-
22
-
23
-
24
-
25
-
26
-
27
-
28
-
29
-
30
-
31
-
32
-
33
-
34
-
35
-
36
-
37
-
38
-
39
-
40
-
41
-
42
-
43
-
44
-
45
-
46
-
47
-
48
-
49
-
50
-
51
-
52
-
53
-
54
-
55
-
56
-
57
-
58
-
59
-
60
-
61
-
 62
62 -
 63
63 -
 64
64 -
 65
65 -
 66
66 -
 67
67 -
 68
68 -
 69
69 -
 70
70 -
 71
71 -
 72
72 -
 73
73 -
 74
74 -
 75
75 -
 76
76 -
 77
77 -
 78
78 -
 79
79 -
 80
80 -
 81
81 -
 82
82 -
83
-
84
-
85
-
86
-
87
-
88
-
89
-
90
-
91
-
92
-
93
-
94
-
95
-
96
-
97
-
98
-
99
-
100
-
101
-
102
-
103
-
104
-
105
-
106
-
107
-
108
-
109
-
110
-
111
-
112
-
113
-
114
-
115
-
116
-
117
-
118
-
119
-
120
-
121
-
122
-
123
-
124
-
125
-
126
-
127
-
128
-
129
-
130
-
131
-
132
-
133
-
134
-
135
-
136
-
137
-
138
-
139
-
140
-
141
-
142
-
143
-
144
-
145
-
146
-
147
-
148
-
149
-
150
-
151
-
152
-
153
-
154
-
155
-
156
-
157
-
158
-
159
-
160
-
161
-
162
-
163
-
164
-
165
-
166
-
167
-
168
-
169
-
170
-
171
-
172
-
173
-
174
-
175
-
176
-
177
-
178
-
179
-
180
-
181
-
182
-
183
-
184
-
185
-
186
-
187
-
188
 |
 |
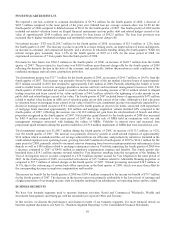
significantly higher expected prepayment speeds that resulted in an impairment of $370.0 million of MSRs. This same
decline in rates generated gains on MBS which were held in our available for sale securities portfolio. During December,
$9.3 billion of MBS were sold generating $413.1 million of gains that were used to offset the MSRs impairment. As of
January 1, 2009, ALCO designated the 2008 MSRs vintage and all future MSRs production as fair value under SFAS
No. 156. The fair value determination, key economic assumptions and the sensitivity of the current fair value of the MSRs as
of December 31, 2008 and December 31, 2007 is discussed in greater detail in Note 11, “Certain Transfers of Financial
Assets, Mortgage Servicing Rights and Variable Interest Entities” to the Consolidated Financial Statements.
We also have market risk through capital stock we hold in the FHLB of Atlanta and Cincinnati. In order to be an FHLB
member, we are required to purchase capital stock in the FHLB. In exchange, members take advantage of competitively
priced advances as a wholesale funding source and access grants and low-cost loans for affordable housing and community-
development projects, amongst other benefits. As of December 31, 2008, we held a total of $493.2 million of capital stock in
the FHLB. In February 2009, we reduced our capital stock holdings in the FHLB by $150.3 million to $342.9 million.
For a detailed overview regarding actions taken to address the risk from changes in equity prices associated with our
investment in Coke common stock, see “Investment in Common Shares of the Coca-Cola Company,” in this MD&A. We
also hold a total of approximately $209 million of private equity investments that include direct investments and limited
partnerships. We hold these investments as long-term investments and make additional contributions based on our
contractual commitments but have decided to limit investments into new private equity investments.
In addition to MSRs impairment, other impairment charges could occur if deteriorating conditions in the market persist,
including, but not limited to, goodwill and other intangibles impairment charges and increased charges with respect to
OREO.
OFF-BALANCE SHEET ARRANGEMENTS
See discussion of off-balance sheet arrangements in Note 11, “Certain Transfers of Financial Assets, Mortgage Servicing
Rights and Variable Interest Entities” and Note 18, “Reinsurance Arrangements and Guarantees”, to the Consolidated
Financial Statements.
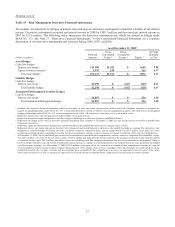
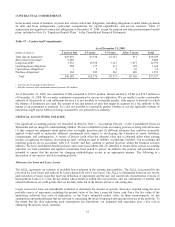
Table 16 – Unfunded Lending Commitments
(Dollars in millions)
December 31
2008
December 31
2007
Unused lines of credit
Commercial $37,167.1 $38,959.1
Mortgage commitments117,010.4 12,859.5
Home equity lines 18,293.8 20,424.9
Commercial real estate 3,652.0 6,228.2
Commercial paper conduit 6,060.3 7,877.5
Credit card 4,167.8 1,808.5
Total unused lines of credit $86,351.4 $88,157.7
Letters of credit
Financial standby $13,622.8 $12,287.5
Performance standby 220.2 283.1
Commercial 99.0 132.3
Total letters of credit $13,942.0 $12,702.9
1Includes $7.2 billion and $5.0 billion in IRLCs accounted for as derivatives as of December 31, 2008 and December 31, 2007,
respectively.
60