SunTrust 2008 Annual Report Download - page 163
Download and view the complete annual report
Please find page 163 of the 2008 SunTrust annual report below. You can navigate through the pages in the report by either clicking on the pages listed below, or by using the keyword search tool below to find specific information within the annual report.-
 1
1 -
2
-
3
-
4
-
5
-
6
-
7
-
8
-
9
-
10
-
11
-
12
-
13
-
14
-
15
-
16
-
17
-
18
-
19
-
20
-
21
-
22
-
23
-
24
-
25
-
26
-
27
-
28
-
29
-
30
-
31
-
32
-
33
-
34
-
35
-
36
-
37
-
38
-
39
-
40
-
41
-
42
-
43
-
44
-
45
-
46
-
47
-
48
-
49
-
50
-
51
-
52
-
53
-
54
-
55
-
56
-
57
-
58
-
59
-
60
-
61
-
62
-
63
-
64
-
65
-
66
-
67
-
68
-
69
-
70
-
71
-
72
-
73
-
74
-
75
-
76
-
77
-
78
-
79
-
80
-
81
-
82
-
83
-
84
-
85
-
86
-
87
-
88
-
89
-
90
-
91
-
92
-
93
-
94
-
95
-
96
-
97
-
98
-
99
-
100
-
101
-
102
-
103
-
104
-
105
-
106
-
107
-
108
-
109
-
110
-
111
-
112
-
113
-
114
-
115
-
116
-
117
-
118
-
119
-
120
-
121
-
122
-
123
-
124
-
125
-
126
-
127
-
128
-
129
-
130
-
131
-
132
-
133
-
134
-
135
-
136
-
137
-
138
-
139
-
140
-
141
-
142
-
143
-
144
-
145
-
146
-
147
-
148
-
149
-
150
-
151
-
152
-
 153
153 -
 154
154 -
 155
155 -
 156
156 -
 157
157 -
 158
158 -
 159
159 -
 160
160 -
 161
161 -
 162
162 -
 163
163 -
 164
164 -
 165
165 -
 166
166 -
 167
167 -
 168
168 -
 169
169 -
 170
170 -
 171
171 -
 172
172 -
 173
173 -
174
-
175
-
176
-
177
-
178
-
179
-
180
-
181
-
182
-
183
-
184
-
185
-
186
-
187
-
188
 |
 |
SUNTRUST BANKS, INC.
Notes to Consolidated Financial Statements (Continued)
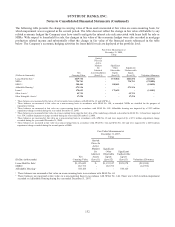
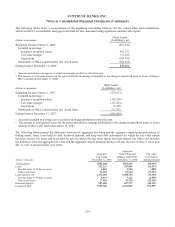
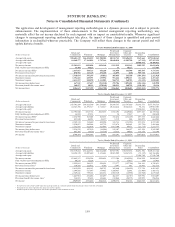
The following tables present financial assets and financial liabilities measured at fair value on a recurring basis and the
change in fair value for those specific financial instruments in which fair value has been elected. The tables do not reflect the
change in fair value attributable to the related economic hedges the Company used to mitigate the interest rate risk associated
with the financial instruments. The changes in the fair value of economic hedges were also recorded in trading account
profits and commissions or mortgage production related income, as appropriate, and are designed to partially offset the
change in fair value of the financial instruments referenced in the tables below. The Company’s economic hedging activities
are deployed at both the instrument and portfolio level.
Fair Value Measurements at
December 31, 2008,
Using
Fair Value Gain/(Loss) for the Year Ended
December 31, 2008, for Items Measured at Fair Value
Pursuant to Election of the Fair Value Option
(Dollars in thousands)
Assets/Liabilities
Measured at
Fair Value
December 31, 2008
Quoted
Prices In
Active
Markets for
Identical
Assets/Liabilities
(Level 1)
Significant
Other
Observable
Inputs
(Level 2)
Significant
Unobservable
Inputs
(Level 3)
Trading Account
Profits and
Commissions
Mortgage
Production
Related
Income
Total
Changes in
Fair Values
Included in
Current-
Period
Earnings2
Assets
Trading assets $10,396,269 $149,321 $8,855,563 $1,391,385 ($6,598) $- ($6,598)
Securities available for sale 19,696,537 1,485,364 16,721,569 1,489,604 - - -
Loans held for sale 2,424,432 - 1,936,987 487,445 - 268,3863268,386
Loans 270,342 - - 270,342 (4,195) (26,066) (30,261)
Other assets 1109,600 775 35,231 73,594 - - -
Liabilities
Brokered deposits 587,486 - 587,486 - 46,007 - 46,007
Trading liabilities 3,240,784 440,436 2,800,348 - - - -
Other short-term borrowings 399,611 - 399,611 - - - -
Long-term debt 7,155,684 - 3,659,423 3,496,261 (65,322) - (65,322)
Other liabilities 172,911 - 71,738 1,173 - - -
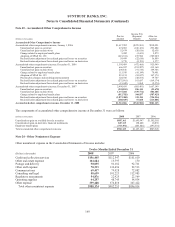
1This amount includes IRLCs and derivative financial instruments entered into by the Mortgage line of business to hedge its interest rate risk. Beginning in 2008, IRLCs were recorded gross, instead
of net, in other assets or liabilities.
2Changes in fair value for the year ended December 31, 2008 exclude accrued interest for the period then ended. Interest income or interest expense on trading assets, loans, loans held for sale,
brokered deposits and long-term debt that have been elected to be carried at fair value under the provisions of SFAS No. 159 or SFAS No. 155 are recorded in interest income or interest expense in
the Consolidated Statements of Income based on their contractual coupons. Certain trading assets do not have a contractually stated coupon and, for these securities, the Company records interest
income based on the effective yield calculated upon acquisition of those securities. For the year ended December 31, 2008, the changes in fair value related to accrued interest income on loans and
loans held for sale were a decrease of $0.1 million and $3.0 million, respectively. For the year ended December 31, 2008, the changes in fair value related to accrued interest expense on brokered
deposits and long-term debt were an increase of approximately $18.7 million and $0.4 million, respectively.
3For the year ended December 31, 2008, these amounts include $464.6 million related to MSR assets recognized upon the sale of the loans.
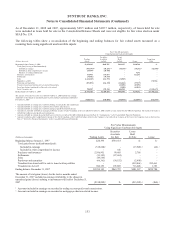
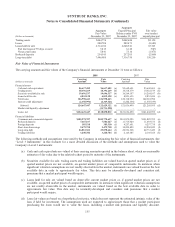
Fair Value Measurements at
December 31, 2007,
Using
Fair Value Gain/(Loss) for the Year Ended
December 31, 2007, for Items Measured at Fair Value Pursuant
to Election of the Fair Value Option
(Dollars in thousands)
Assets/Liabilities
Measured at
Fair Value
December 31, 2007
Quoted
Prices In
Active
Markets for
Identical
Assets
(Level 1)
Significant
Other
Observable
Inputs
(Level 2)
Significant
Unobservable
Inputs
(Level 3)
Trading Account
Profits and
Commissions
Mortgage
Production
Related
Income
Total
Changes in
Fair Values
Included in
Current-
Period
Earnings1
Assets
Trading assets $10,518,379 $294,412 $7,273,822 $2,950,145 ($151,695) $- ($151,695)
Securities available for sale 16,264,107 2,815,488 12,578,912 869,707 - - -
Loans held for sale 6,325,160 - 5,843,833 481,327 - 81,561281,561
Loans 220,784 - - 220,784 - (1,712) (1,712)
Other assets369,405 2,781 66,624 - - - -
Liabilities
Brokered deposits 234,345 - 234,345 - 7,686 - 7,686
Trading liabilities 2,160,385 592,678 1,567,707 - - - -
Long-term debt 7,446,980 - 7,446,980 - (70,927) - (70,927)
Other liabilities356,189 73 36,513 19,603 - - -
1Changes in fair value for the twelve months ended December 31, 2007 exclude accrued interest for the period then ended. Interest income or interest expense on trading assets, loans held for sale, brokered
deposits and long-term debt that have been elected to be carried at fair value under the provisions of SFAS No. 159 or SFAS No. 155 are recorded in interest income or interest expense in the Consolidated
Statements of Income based on their contractual coupons. Certain trading assets do not have a contractually stated coupon and, for these securities, the Company records interest income based on the effective
yield calculated upon acquisition of those securities. For the twelve months ended December 31, 2007, the change in fair value related to accrued interest income on loans held for sale was an increase of
$11.1 million and the change in fair value related to accrued interest expense on brokered deposits and long-term debt was an increase of $8.7 million and an increase of $4.2 million, respectively.
2This amount includes $214.6 million related to MSR assets recognized upon the sale of the loans.
3This amount includes interest rate lock commitments and derivative financial instruments entered into by the Mortgage line of business to hedge its interest rate risk. Beginning in 2008, interest rate lock
commitments were recorded gross, instead of net, in other assets or other liabilities. Had SunTrust recorded interest rate lock commitments gross as of year end, the Company would have recorded an asset of
$6.8 million and a liability of $26.4 million.
151