SunTrust 2008 Annual Report Download - page 134
Download and view the complete annual report
Please find page 134 of the 2008 SunTrust annual report below. You can navigate through the pages in the report by either clicking on the pages listed below, or by using the keyword search tool below to find specific information within the annual report.-
 1
1 -
2
-
3
-
4
-
5
-
6
-
7
-
8
-
9
-
10
-
11
-
12
-
13
-
14
-
15
-
16
-
17
-
18
-
19
-
20
-
21
-
22
-
23
-
24
-
25
-
26
-
27
-
28
-
29
-
30
-
31
-
32
-
33
-
34
-
35
-
36
-
37
-
38
-
39
-
40
-
41
-
42
-
43
-
44
-
45
-
46
-
47
-
48
-
49
-
50
-
51
-
52
-
53
-
54
-
55
-
56
-
57
-
58
-
59
-
60
-
61
-
62
-
63
-
64
-
65
-
66
-
67
-
68
-
69
-
70
-
71
-
72
-
73
-
74
-
75
-
76
-
77
-
78
-
79
-
80
-
81
-
82
-
83
-
84
-
85
-
86
-
87
-
88
-
89
-
90
-
91
-
92
-
93
-
94
-
95
-
96
-
97
-
98
-
99
-
100
-
101
-
102
-
103
-
104
-
105
-
106
-
107
-
108
-
109
-
110
-
111
-
112
-
113
-
114
-
115
-
116
-
117
-
118
-
119
-
120
-
121
-
122
-
123
-
 124
124 -
 125
125 -
 126
126 -
 127
127 -
 128
128 -
 129
129 -
 130
130 -
 131
131 -
 132
132 -
 133
133 -
 134
134 -
 135
135 -
 136
136 -
 137
137 -
 138
138 -
 139
139 -
 140
140 -
 141
141 -
 142
142 -
 143
143 -
 144
144 -
145
-
146
-
147
-
148
-
149
-
150
-
151
-
152
-
153
-
154
-
155
-
156
-
157
-
158
-
159
-
160
-
161
-
162
-
163
-
164
-
165
-
166
-
167
-
168
-
169
-
170
-
171
-
172
-
173
-
174
-
175
-
176
-
177
-
178
-
179
-
180
-
181
-
182
-
183
-
184
-
185
-
186
-
187
-
188
 |
 |

SUNTRUST BANKS, INC.
Notes to Consolidated Financial Statements (Continued)
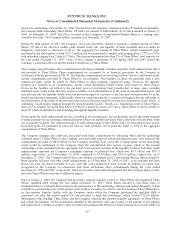
Maturities of long-term debt are: 2009 – $1,536.5 million; 2010 – $3,637.5 million; 2011 – $6,442.8 million; 2012 –
$7,185.5 million; 2013 – $126.7 million; and thereafter—$7,883.4 million. Restrictive provisions of several long-term debt
agreements prevent the Company from creating liens on, disposing of, or issuing (except to related parties) voting stock of
subsidiaries.
Further, there are restrictions on mergers, consolidations, certain leases, sales or transfers of assets, minimum shareholders’
equity, and maximum borrowings by the Company. As of December 31, 2008, the Company was in compliance with all
covenants and provisions of long-term debt agreements. As currently defined by federal bank regulators, long-term debt of
$2,847.3 million and $2,133.3 million as of December 31, 2008 and 2007, respectively, qualified as Tier 1 capital and long-
term debt of $3,008.3 million and $3,073.2 million as of December 31, 2008 and 2007, respectively, qualified as Tier 2
capital. As of December 31, 2008, the Company had collateral pledged to the FHLB of Atlanta to support $4.5 billion of
available borrowing capacity.
In connection with FIN 46(R), the Company does not consolidate certain wholly-owned trusts which had been formed for the
sole purpose of issuing trust preferred securities. The proceeds from the trust preferred securities issuances were invested in
junior subordinated debentures of the Parent Company and Bank Parent Company. The obligations of these debentures
constitute a full and unconditional guarantee by the Parent Company and Bank Parent Company of the trust preferred
securities.
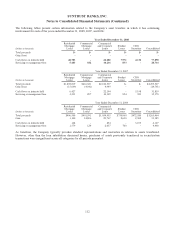
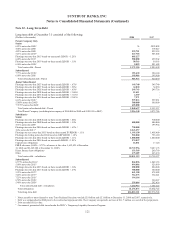
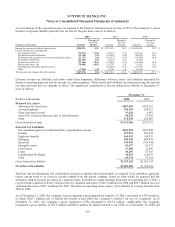
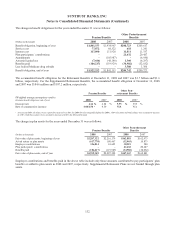
Note 13 - Earnings Per Share
Net income is the same in the calculation of basic and diluted EPS. Equivalent shares of 33.5 million and 9.1 million related
to common stock options and common stock warrants for the years ended December 31, 2008 and 2007, respectively, were
excluded from the computations of diluted EPS because they would have been antidilutive. There were no antidilutive shares
for the year ending December 31, 2006. A reconciliation of the difference between average basic common shares outstanding
and average diluted common shares outstanding for the twelve months ended December 31 is included in the following table:
(In thousands, except per share data) 2008 2007 2006
Net income $795,774 $1,634,015 $2,117,471
Series A preferred dividends 22,255 30,275 7,729
U.S. Treasury preferred dividends 26,579 --
Net income available to common shareholders $746,940 $1,603,740 $2,109,742
Average basic common shares 348,919 349,346 359,413
Effect of dilutive securities:
Stock options 190 2,396 2,261
Performance and restricted stock 1,074 946 1,128
Average diluted common shares 350,183 352,688 362,802
Earnings per average common share - diluted $2.13 $4.55 $5.82
Earnings per average common share - basic $2.14 $4.59 $5.87
122