SunTrust 2008 Annual Report Download - page 66
Download and view the complete annual report
Please find page 66 of the 2008 SunTrust annual report below. You can navigate through the pages in the report by either clicking on the pages listed below, or by using the keyword search tool below to find specific information within the annual report.-
 1
1 -
2
-
3
-
4
-
5
-
6
-
7
-
8
-
9
-
10
-
11
-
12
-
13
-
14
-
15
-
16
-
17
-
18
-
19
-
20
-
21
-
22
-
23
-
24
-
25
-
26
-
27
-
28
-
29
-
30
-
31
-
32
-
33
-
34
-
35
-
36
-
37
-
38
-
39
-
40
-
41
-
42
-
43
-
44
-
45
-
46
-
47
-
48
-
49
-
50
-
51
-
52
-
53
-
54
-
55
-
 56
56 -
 57
57 -
 58
58 -
 59
59 -
 60
60 -
 61
61 -
 62
62 -
 63
63 -
 64
64 -
 65
65 -
 66
66 -
 67
67 -
 68
68 -
 69
69 -
 70
70 -
 71
71 -
 72
72 -
 73
73 -
 74
74 -
 75
75 -
 76
76 -
77
-
78
-
79
-
80
-
81
-
82
-
83
-
84
-
85
-
86
-
87
-
88
-
89
-
90
-
91
-
92
-
93
-
94
-
95
-
96
-
97
-
98
-
99
-
100
-
101
-
102
-
103
-
104
-
105
-
106
-
107
-
108
-
109
-
110
-
111
-
112
-
113
-
114
-
115
-
116
-
117
-
118
-
119
-
120
-
121
-
122
-
123
-
124
-
125
-
126
-
127
-
128
-
129
-
130
-
131
-
132
-
133
-
134
-
135
-
136
-
137
-
138
-
139
-
140
-
141
-
142
-
143
-
144
-
145
-
146
-
147
-
148
-
149
-
150
-
151
-
152
-
153
-
154
-
155
-
156
-
157
-
158
-
159
-
160
-
161
-
162
-
163
-
164
-
165
-
166
-
167
-
168
-
169
-
170
-
171
-
172
-
173
-
174
-
175
-
176
-
177
-
178
-
179
-
180
-
181
-
182
-
183
-
184
-
185
-
186
-
187
-
188
 |
 |

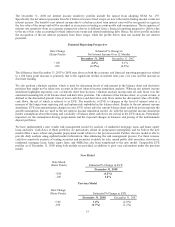
The change in the comparable EVE profile from December 31, 2007 to December 31, 2008 can be attributed to the net
impact of lower interest rates, lower pricing sensitivity on indeterminate maturity deposit products and lower valuations of
loans, deposits and MSRs. The difference between the two profiles at December 31, 2008 is as a result of slower
prepayments in the aforementioned models. This change in prepayments caused the value sensitivity of assets to interest rates
in the new model to be greater than that of liabilities, while the value sensitivity of assets to rates in the previous model
remained lower than that of liabilities. While an instantaneous and severe shift in interest rates is used in this analysis to
provide an estimate of exposure under an extremely adverse scenario, we believe that a gradual shift in interest rates would
have a much more modest impact. Since EVE measures the discounted present value of cash flows over the estimated lives
of instruments, the change in EVE does not directly correlate to the degree that earnings would be impacted over a shorter
time horizon (i.e., the current fiscal year). Further, EVE does not take into account factors such as future balance sheet
growth, changes in product mix, changes in yield curve relationships, and changing product spreads that could mitigate the
adverse impact of changes in interest rates. The net interest income simulation and EVE analyses do not necessarily include
certain actions that management may undertake to manage this risk in response to anticipated changes in interest rates.
Trading Activities
Beginning in 2007 and continuing into 2008, we expanded the use of trading securities as part of our overall balance sheet
management strategies. The remainder of our actively traded securities, other than corporate treasury trading securities, are
primarily held to support customer requirements through our broker/dealer subsidiary. Product offerings to clients include
debt securities, loans traded in the secondary market, equity securities, derivatives and foreign exchange contracts and
similar financial instruments. Other trading activities include acting as a market maker in certain debt and equity securities
and related derivatives. Typically, we maintain a securities inventory to facilitate customer transactions. Also in the normal
course of business, we assume a degree of market risk in proprietary trading, hedging, and other strategies, subject to
specified limits.
We have developed policies and procedures to manage market risk associated with trading, capital markets and foreign
exchange activities using a value-at-risk (“VaR”) approach that determines total exposure arising from interest rate risk,
equity risk, foreign exchange risk, spread risk and volatility risk. For trading portfolios, VaR measures the estimated
maximum loss from a trading position, given a specified confidence level and time horizon. VaR exposures and actual results
are monitored daily for each trading portfolio. Our VaR calculation measures the potential losses using a 99% confidence
level with a one day holding period. This means that, on average, losses are expected to exceed VaR two or three times per
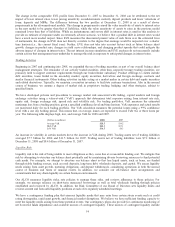
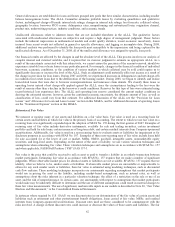
year. The following table displays high, low, and average VaR for 2008 and 2007.
(Dollars in millions) 2008 2007
Average VaR $28.5 $14.2
High VaR $42.3 $33.1
Low VaR $16.5 $6.3
An increase in volatility in certain markets drove the increase in VaR during 2008. Trading assets net of trading liabilities
averaged $7.7 billion for 2008 and $11.5 billion for 2007. Trading assets net of trading liabilities were $7.2 billion at
December 31, 2008 and $8.4 billion at December 31, 2007.
Liquidity Risk
Liquidity risk is the risk of being unable to meet obligations as they come due at a reasonable funding cost. We mitigate this
risk by attempting to structure our balance sheet prudently and by maintaining diverse borrowing resources to fund potential
cash needs. For example, we attempt to structure our balance sheet so that less liquid assets, such as loans, are funded
through stable funding sources, such as retail deposits, long-term debt, wholesale deposits, and capital. We assess liquidity
needs arising from asset growth, maturing obligations, and deposit withdrawals, considering operations in both the normal
course of business and times of unusual events. In addition, we consider our off-balance sheet arrangements and
commitments that may drain liquidity in certain business environments.
Our ALCO measures liquidity risks, sets policies to manage these risks, and reviews adherence to those policies. For
example, we manage reliance on short-term unsecured borrowings as well as total wholesale funding through policies
established and reviewed by ALCO. In addition, the Risk Committee of our Board of Directors sets liquidity limits and
reviews current and forecasted liquidity positions at each of its regularly scheduled meetings.
We have a contingency funding plan that assesses liquidity needs that may arise from certain stress events such as credit
rating downgrades, rapid asset growth, and financial market disruptions. We believe we have sufficient funding capacity to
meet the liquidity needs arising from these potential events. Our contingency plans also provide for continuous monitoring of
net borrowed funds dependence and available sources of contingent liquidity. These sources of contingent liquidity include
54