SunTrust 2008 Annual Report Download - page 44
Download and view the complete annual report
Please find page 44 of the 2008 SunTrust annual report below. You can navigate through the pages in the report by either clicking on the pages listed below, or by using the keyword search tool below to find specific information within the annual report.-
 1
1 -
2
-
3
-
4
-
5
-
6
-
7
-
8
-
9
-
10
-
11
-
12
-
13
-
14
-
15
-
16
-
17
-
18
-
19
-
20
-
21
-
22
-
23
-
24
-
25
-
26
-
27
-
28
-
29
-
30
-
31
-
32
-
33
-
 34
34 -
 35
35 -
 36
36 -
 37
37 -
 38
38 -
 39
39 -
 40
40 -
 41
41 -
 42
42 -
 43
43 -
 44
44 -
 45
45 -
 46
46 -
 47
47 -
 48
48 -
 49
49 -
 50
50 -
 51
51 -
 52
52 -
 53
53 -
 54
54 -
55
-
56
-
57
-
58
-
59
-
60
-
61
-
62
-
63
-
64
-
65
-
66
-
67
-
68
-
69
-
70
-
71
-
72
-
73
-
74
-
75
-
76
-
77
-
78
-
79
-
80
-
81
-
82
-
83
-
84
-
85
-
86
-
87
-
88
-
89
-
90
-
91
-
92
-
93
-
94
-
95
-
96
-
97
-
98
-
99
-
100
-
101
-
102
-
103
-
104
-
105
-
106
-
107
-
108
-
109
-
110
-
111
-
112
-
113
-
114
-
115
-
116
-
117
-
118
-
119
-
120
-
121
-
122
-
123
-
124
-
125
-
126
-
127
-
128
-
129
-
130
-
131
-
132
-
133
-
134
-
135
-
136
-
137
-
138
-
139
-
140
-
141
-
142
-
143
-
144
-
145
-
146
-
147
-
148
-
149
-
150
-
151
-
152
-
153
-
154
-
155
-
156
-
157
-
158
-
159
-
160
-
161
-
162
-
163
-
164
-
165
-
166
-
167
-
168
-
169
-
170
-
171
-
172
-
173
-
174
-
175
-
176
-
177
-
178
-
179
-
180
-
181
-
182
-
183
-
184
-
185
-
186
-
187
-
188
 |
 |

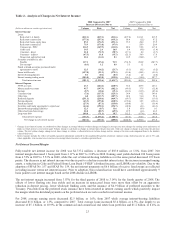
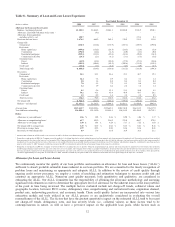
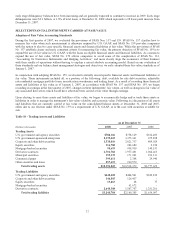
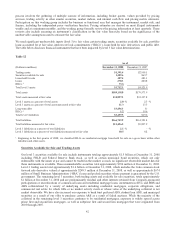
Table 8 - Summary of Loan and Lease Losses Experience
Year Ended December 31
(Dollars in millions) 2008 2007 2006 2005 2004 2003
Allowance for Loan and Lease Losses
Balance - beginning of period $1,282.5 $1,044.5 $1,028.1 $1,050.0 $941.9 $930.1
Allowance associated with loans at fair value 1-(4.1) - - - -
Allowance from acquisitions
and other activity - net 158.7 - - - 173.8 9.3
Provision for loan losses 2,474.2 664.9 262.5 176.9 135.5 313.6
Charge-offs:
Commercial (218.7) (133.6) (178.9) (107.3) (109.7) (195.0)
Real estate:
Home equity lines (449.6) (116.2) (28.8) (24.5) (12.6) (5.8)
Construction (194.5) (12.2) (2.3) (6.0) (4.1) (0.8)
Residential mortgages (525.1) (113.1) (29.6) (22.8) (20.2) (16.3)
Commercial real estate (24.7) (2.1) (8.1) (3.1) (5.5) (5.6)
Consumer loans:
Direct (41.9) (23.4) (22.0) (37.2) (25.1) (28.6)
Indirect (192.9) (106.4) (82.3) (109.6) (133.9) (139.5)
Credit card (33.1) (7.3) (4.6) (4.7) (4.9) (2.7)
Total charge-offs (1,680.5) (514.3) (356.6) (315.2) (316.0) (394.3)
Recoveries:
Commercial 24.1 23.3 28.6 35.1 48.7 39.3
Real estate:
Home equity lines 16.4 7.8 6.9 6.2 3.3 1.4
Construction 2.8 1.2 2.0 0.8 0.1 0.4
Residential mortgages 7.8 5.5 7.9 8.1 6.4 3.6
Commercial real estate 1.2 1.9 6.2 2.6 1.4 1.4
Consumer loans:
Direct 8.2 9.6 12.1 13.5 10.0 8.5
Indirect 54.2 41.3 45.4 48.9 43.7 28.1
Credit card 1.5 0.9 1.4 1.2 1.2 0.5
Total recoveries 116.2 91.5 110.5 116.4 114.8 83.2
Net charge-offs (1,564.3) (422.8) (246.1) (198.8) (201.2) (311.1)
Balance - end of period $2,351.1 $1,282.5 $1,044.5 $1,028.1 $1,050.0 $941.9
Average loans $125,432.7 $120,080.6 $119,645.2 $108,742.0 $86,214.5 $76,137.9
Year-end loans outstanding 126,998.4 122,319.0 121,454.3 114,554.9 101,426.2 80,732.3
Ratios:
Allowance to year-end loans21.86 % 1.05 % 0.86 % 0.90 % 1.04 % 1.17 %
Allowance to nonperforming loans361.7 101.9 216.9 378.0 404.7 279.8
Allowance to net charge-offs 1.50 x 3.03 x 4.24 x 5.17 x 5.22 x 3.03 x
Net charge-offs to average loans 1.25 % 0.35 % 0.21 % 0.18 % 0.23 % 0.41 %
Provision to average loans 1.97 0.55 0.22 0.16 0.16 0.41
Recoveries to total charge-offs 6.9 17.8 31.0 36.9 36.3 21.1
1Amount removed from the ALLL related to our election to record $4.1 billion of residential mortgages at fair value.
2During the second quarter of 2008, the Company revised its method of calculating this ratio to include, within the period-end loan amount, only loans measured at amortized cost. Previously, period-end loans included
loans measured at fair value or the lower of cost or market. The Company believes this is an improved method of calculation due to the fact that the allowance for loan losses relates solely to the loans measured at
amortized cost. Loans measured at fair value or the lower of cost or market that have been excluded from the prior period calculation were $392.3 million, which did not change the calculation by more than one basis
point as of December 31, 2007. Amounts excluded in years prior to 2007 were immaterial and resulted in no basis point change in the respective calculation.
3During the second quarter of 2008, the Company revised its method of calculating this ratio to include, within the nonperforming loan amount, only loans measured at amortized cost. Previously, this calculation
included nonperforming loans measured at fair value or the lower of cost or market. The Company believes this is an improved method of calculation due to the fact that the allowance for loan losses relates solely to
the loans measured at amortized cost. Nonperforming loans measured at fair value or the lower of cost or market that have been excluded from the prior period calculation were $171.5 million, which increased the
calculation approximately 12 basis points as of December 31, 2007. Amounts excluded in years prior to 2007 were immaterial and resulted in no basis point change in the respective calculation.
Allowance for Loan and Lease Losses
We continuously monitor the quality of our loan portfolio and maintain an allowance for loan and lease losses (“ALLL”)
sufficient to absorb probable estimable losses inherent in our loan portfolio. We are committed to the timely recognition of
problem loans and maintaining an appropriate and adequate ALLL. In addition to the review of credit quality through
ongoing credit review processes, we employ a variety of modeling and estimation techniques to measure credit risk and
construct an appropriate ALLL. Numerous asset quality measures, both quantitative and qualitative, are considered in
estimating the ALLL. Our ALLL Committee has the responsibility of affirming the allowance methodology and assessing
significant risk elements in order to determine the appropriate level of allowance for the inherent losses in the loan portfolio
at the point in time being reviewed. The multiple factors evaluated include net charge-off trends, collateral values and
geographic location, borrower FICO scores, delinquency rates, nonperforming and restructured loans, origination channel,
product mix, underwriting practices, and economic trends. These credit quality factors are incorporated into various loss
estimation models and tools utilized in our ALLL process or are qualitatively considered in evaluating the overall
reasonableness of the ALLL. The factors that have the greatest quantitative impact on the estimated ALLL tend to be recent
net charge-off trends, delinquency rates, and loss severity levels (i.e., collateral values), as these factors tend to be
contemporaneous in nature, as well as have a pervasive impact on the applicable loan pools, while factors such as
32