SunTrust 2008 Annual Report Download - page 38
Download and view the complete annual report
Please find page 38 of the 2008 SunTrust annual report below. You can navigate through the pages in the report by either clicking on the pages listed below, or by using the keyword search tool below to find specific information within the annual report.-
 1
1 -
2
-
3
-
4
-
5
-
6
-
7
-
8
-
9
-
10
-
11
-
12
-
13
-
14
-
15
-
16
-
17
-
18
-
19
-
20
-
21
-
22
-
23
-
24
-
25
-
26
-
27
-
 28
28 -
 29
29 -
 30
30 -
 31
31 -
 32
32 -
 33
33 -
 34
34 -
 35
35 -
 36
36 -
 37
37 -
 38
38 -
 39
39 -
 40
40 -
 41
41 -
 42
42 -
 43
43 -
 44
44 -
 45
45 -
 46
46 -
 47
47 -
 48
48 -
49
-
50
-
51
-
52
-
53
-
54
-
55
-
56
-
57
-
58
-
59
-
60
-
61
-
62
-
63
-
64
-
65
-
66
-
67
-
68
-
69
-
70
-
71
-
72
-
73
-
74
-
75
-
76
-
77
-
78
-
79
-
80
-
81
-
82
-
83
-
84
-
85
-
86
-
87
-
88
-
89
-
90
-
91
-
92
-
93
-
94
-
95
-
96
-
97
-
98
-
99
-
100
-
101
-
102
-
103
-
104
-
105
-
106
-
107
-
108
-
109
-
110
-
111
-
112
-
113
-
114
-
115
-
116
-
117
-
118
-
119
-
120
-
121
-
122
-
123
-
124
-
125
-
126
-
127
-
128
-
129
-
130
-
131
-
132
-
133
-
134
-
135
-
136
-
137
-
138
-
139
-
140
-
141
-
142
-
143
-
144
-
145
-
146
-
147
-
148
-
149
-
150
-
151
-
152
-
153
-
154
-
155
-
156
-
157
-
158
-
159
-
160
-
161
-
162
-
163
-
164
-
165
-
166
-
167
-
168
-
169
-
170
-
171
-
172
-
173
-
174
-
175
-
176
-
177
-
178
-
179
-
180
-
181
-
182
-
183
-
184
-
185
-
186
-
187
-
188
 |
 |
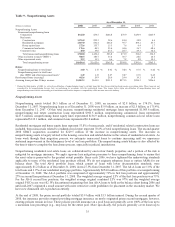
sale, in part due to the elimination of Alt-A loans from the warehouse. The increase was also a result of lower valuation
losses on illiquid and delinquent warehouse loans and the earlier recognition of servicing value and origination fees resulting
from our election to record certain mortgage loans at fair value beginning in May 2007. The prior period also included $42.2
million of income reductions recorded in conjunction with our election to record certain loans held for sale at fair value.
These increases in income when compared with 2007 were offset by an increase in our reserve for write-downs on mortgage
loans that we anticipate we will have to repurchase from prior sales. This reserve is established at the time of the sale based
on expectations for the volume of repurchases and the severity of losses upon ultimate disposition. In the current
environment, higher customer default rates, heightened scrutiny of loan documentation by investors, and larger write-downs
upon repurchase are all impacting the level of required reserves. In addition to this offset to mortgage production related
income, we also incurred negative valuation adjustments on our portfolio loans and loans held for sale carried at fair value
and lower fee income associated with lower production volume. While loan production is down, the percentage of agency
eligible secondary market production increased to approximately 98% of secondary market production compared to
approximately 85% in 2007. Agency eligible loans, also known as conforming loans, are defined as mortgage loans eligible
for secondary market purchase by GNMA, FNMA, or FHLMC. To be considered eligible, loans must adhere to maximum
loan amount guidelines, debt-to-income ratio limits, and stricter documentation requirements. In addition, dramatically lower
mortgage rates near the end of 2008 drove a significant increase in application activity, which has continued into early 2009.
Investment banking income increased $21.6 million, or 10.1%, compared to 2007, due to increases in direct finance and bond
underwriting fees. These increases were partially offset by a decrease in M&A fees.
Net gain on the sale of businesses consists of an $89.4 million gain on the sale of our remaining interest in Lighthouse
Investment Partners during the first quarter of 2008, an $81.8 million gain on the sale of TransPlatinum, our former fuel card
and fleet management subsidiary in the third quarter of 2008, a $29.6 million gain on the sale of First Mercantile, a
retirement plan services subsidiary, during the second quarter of 2008, and a $2.7 million loss on the sale of a majority
interest in Zevenbergen Capital Investments during the fourth quarter of 2008. A gain of $32.3 million was recognized in
2007 upon the merger of Lighthouse Partners.
During the first quarter of 2008, Visa completed its IPO and upon the closing, approximately 2 million of our Class B shares
were mandatorily redeemed for $86.3 million, which was recorded as a gain in noninterest income.
Net securities gains of $1.1 billion for 2008 included a $732.2 million gain on the sale and contribution of a portion of our
investment in Coke common stock in addition to a $413.1 million gain on the sale of MBS held in conjunction with our risk
management strategies associated with economically hedging the value of MSRs. These gains were partially offset by the
recognition through earnings of $83.8 million in charges related to certain ABS that were determined in 2008 to be other-
than-temporarily impaired. The net securities gains of $243.1 million for 2007 included a $234.8 million gain on the sale of
4.5 million shares of Coke common stock. For additional information on transactions related to our holdings in Coke
common stock, refer to “Investment in Common Shares of The Coca-Cola Company” within this MD&A.
During the fourth quarter of 2007, we completed multiple sale/leaseback transactions, consisting of over 300 of our branch
properties and various individual office buildings. In total, we sold and concurrently leased back $545.9 million in land and
buildings with associated accumulated depreciation of $285.7 million. For the year ended December 31, 2007, we recognized
$118.8 million of the gain immediately while the remaining $385.4 million in gains were deferred and will be recognized
ratably over the expected term of the respective leases, predominantly 10 years, as an offset to net occupancy expense.
During 2008, we completed sale/leaseback transactions, consisting of 152 branch properties and various individual office
buildings. In total, we sold and concurrently leased back $201.9 million in land and buildings with associated accumulated
depreciation of $110.3 million. For the year ended December 31, 2008, we recognized $37.0 million of the gain immediately
while the remaining $160.3 million in gains were deferred and will be recognized ratably over the expected term of the
respective leases, predominantly as an offset to net occupancy expense.
Other income decreased $110.3 million, or 31.5%, compared to 2007. The decline was primarily due to gains in 2007 on
private equity transactions that did not recur in 2008.
26