SunTrust 2008 Annual Report Download - page 41
Download and view the complete annual report
Please find page 41 of the 2008 SunTrust annual report below. You can navigate through the pages in the report by either clicking on the pages listed below, or by using the keyword search tool below to find specific information within the annual report.-
 1
1 -
2
-
3
-
4
-
5
-
6
-
7
-
8
-
9
-
10
-
11
-
12
-
13
-
14
-
15
-
16
-
17
-
18
-
19
-
20
-
21
-
22
-
23
-
24
-
25
-
26
-
27
-
28
-
29
-
30
-
 31
31 -
 32
32 -
 33
33 -
 34
34 -
 35
35 -
 36
36 -
 37
37 -
 38
38 -
 39
39 -
 40
40 -
 41
41 -
 42
42 -
 43
43 -
 44
44 -
 45
45 -
 46
46 -
 47
47 -
 48
48 -
 49
49 -
 50
50 -
 51
51 -
52
-
53
-
54
-
55
-
56
-
57
-
58
-
59
-
60
-
61
-
62
-
63
-
64
-
65
-
66
-
67
-
68
-
69
-
70
-
71
-
72
-
73
-
74
-
75
-
76
-
77
-
78
-
79
-
80
-
81
-
82
-
83
-
84
-
85
-
86
-
87
-
88
-
89
-
90
-
91
-
92
-
93
-
94
-
95
-
96
-
97
-
98
-
99
-
100
-
101
-
102
-
103
-
104
-
105
-
106
-
107
-
108
-
109
-
110
-
111
-
112
-
113
-
114
-
115
-
116
-
117
-
118
-
119
-
120
-
121
-
122
-
123
-
124
-
125
-
126
-
127
-
128
-
129
-
130
-
131
-
132
-
133
-
134
-
135
-
136
-
137
-
138
-
139
-
140
-
141
-
142
-
143
-
144
-
145
-
146
-
147
-
148
-
149
-
150
-
151
-
152
-
153
-
154
-
155
-
156
-
157
-
158
-
159
-
160
-
161
-
162
-
163
-
164
-
165
-
166
-
167
-
168
-
169
-
170
-
171
-
172
-
173
-
174
-
175
-
176
-
177
-
178
-
179
-
180
-
181
-
182
-
183
-
184
-
185
-
186
-
187
-
188
 |
 |

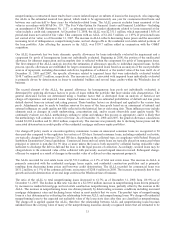
tax years 1997 through 2004 are still in dispute. We have paid the amounts assessed by the IRS in full for tax years 1997 and
1998 and have filed refund claims with the IRS related to the disputed issues for those two years. An IRS examination of our
2005 and 2006 federal income tax returns is currently in progress. Generally, the state jurisdictions in which we file income
tax returns are subject to examination for a period from three to seven years after returns are filed.
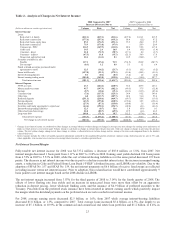
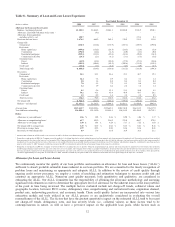
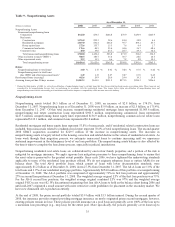
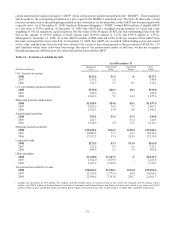
Table 5 - Loan Portfolio by Types of Loans
As of December 31
(Dollars in millions) 2008 2007 2006 2005 2004 2003
Commercial $41,039.9 $35,929.4 $34,613.9 $33,764.2 $31,823.8 $30,681.9
Real estate:
Residential mortgages 32,065.8 32,779.7 33,830.1 29,877.3 24,553.5 17,208.1
Home equity lines 16,454.4 14,911.6 14,102.7 13,635.7 11,519.2 6,965.3
Construction 9,864.0 13,776.7 13,893.0 11,046.9 7,845.4 4,479.8
Commercial real estate 14,957.1 12,609.5 12,567.8 12,516.0 12,083.8 9,330.1
Consumer:
Direct 5,139.3 3,963.9 4,160.1 5,060.8 6,622.3 3,539.6
Indirect 6,507.6 7,494.1 7,936.0 8,389.5 6,802.9 8,394.5
Credit card 970.3 854.1 350.7 264.5 175.3 133.0
Total loans $126,998.4 $122,319.0 $121,454.3 $114,554.9 $101,426.2 $80,732.3
Loans held for sale $4,032.1 $8,851.7 $11,790.1 $13,695.6 $6,580.2 $5,552.1
Table 6 - Funded Exposures by Selected Industries1
As of December 31, 2008 As of December 31, 2007
(Dollars in millions) Loans
% of Total
Loans Loans
% of Total
Loans
Real estate $9,291.1 7.3 % $8,338.5 6.8 %
Construction 8,727.3 6.9 8,615.8 7.0
Retail trade 5,352.1 4.2 5,445.9 4.5
Manufacturing 4,366.0 3.4 3,513.9 2.9
Wholesale trade 3,767.0 3.0 3,376.0 2.8
Health & social assistance 3,557.9 2.8 2,922.3 2.4
Finance & insurance 3,352.0 2.6 2,891.7 2.4
Professional, scientific & technical services 2,297.5 1.8 2,108.6 1.7
Information 2,123.5 1.7 1,456.6 1.2
Public administration 2,012.7 1.6 1,864.1 1.5
Nonprofits 1,941.4 1.5 1,829.8 1.5
Transportation & warehousing 1,918.4 1.5 1,674.1 1.4
Accomodation & food services 1,739.0 1.4 1,441.9 1.2
Mining 1,359.1 1.1 1,144.2 0.9
Arts, entertainment & recreation 1,254.8 1.0 1,145.1 0.9
Administrative and support 1,107.2 0.9 1,057.7 0.9
1Industry groupings are loans in aggregate greater than $1 billion as of December 31, 2008 based on the North American Industry Classification System.
Loans
Total loans as of December 31, 2008 were $127.0 billion, an increase of $4.7 billion, or 3.8%, from December 31, 2007. The
increase was primarily driven by growth in commercial loans, commercial real estate, and home equity lines. These increases
were partially offset by a decrease in real estate construction loans. We believe that our portfolio is well diversified by
product, client, and geography throughout our footprint, and has relatively low exposure to unsecured consumer loan
products. A portion of the increase, approximately $1.0 billion as of December 31, 2008, came as a result of the loans
acquired in the GB&T purchase during the second quarter of 2008.
Commercial loans were $41.0 billion, an increase of $5.1 billion, or 14.2%, from December 31, 2007, and comprise 32.3% of
the total loan portfolio at December 31, 2008. The commercial loan portfolio is well diversified by industry, collateral, and
geography. The primary reason for the increase was the disruption in the short-term corporate funding markets during the
second half of 2008, resulting in certain commercial and large corporate clients accessing bank lines for funding. As such,
beginning in the third quarter of 2008 in particular, we experienced an increase in the utilization levels of our outstanding
commercial loan facilities. Overall, the portfolio has performed well but, depending on the economy, losses could increase in
future periods.
29