SunTrust 2008 Annual Report Download - page 91
Download and view the complete annual report
Please find page 91 of the 2008 SunTrust annual report below. You can navigate through the pages in the report by either clicking on the pages listed below, or by using the keyword search tool below to find specific information within the annual report.-
 1
1 -
2
-
3
-
4
-
5
-
6
-
7
-
8
-
9
-
10
-
11
-
12
-
13
-
14
-
15
-
16
-
17
-
18
-
19
-
20
-
21
-
22
-
23
-
24
-
25
-
26
-
27
-
28
-
29
-
30
-
31
-
32
-
33
-
34
-
35
-
36
-
37
-
38
-
39
-
40
-
41
-
42
-
43
-
44
-
45
-
46
-
47
-
48
-
49
-
50
-
51
-
52
-
53
-
54
-
55
-
56
-
57
-
58
-
59
-
60
-
61
-
62
-
63
-
64
-
65
-
66
-
67
-
68
-
69
-
70
-
71
-
72
-
73
-
74
-
75
-
76
-
77
-
78
-
79
-
80
-
 81
81 -
 82
82 -
 83
83 -
 84
84 -
 85
85 -
 86
86 -
 87
87 -
 88
88 -
 89
89 -
 90
90 -
 91
91 -
 92
92 -
 93
93 -
 94
94 -
 95
95 -
 96
96 -
 97
97 -
 98
98 -
 99
99 -
 100
100 -
 101
101 -
102
-
103
-
104
-
105
-
106
-
107
-
108
-
109
-
110
-
111
-
112
-
113
-
114
-
115
-
116
-
117
-
118
-
119
-
120
-
121
-
122
-
123
-
124
-
125
-
126
-
127
-
128
-
129
-
130
-
131
-
132
-
133
-
134
-
135
-
136
-
137
-
138
-
139
-
140
-
141
-
142
-
143
-
144
-
145
-
146
-
147
-
148
-
149
-
150
-
151
-
152
-
153
-
154
-
155
-
156
-
157
-
158
-
159
-
160
-
161
-
162
-
163
-
164
-
165
-
166
-
167
-
168
-
169
-
170
-
171
-
172
-
173
-
174
-
175
-
176
-
177
-
178
-
179
-
180
-
181
-
182
-
183
-
184
-
185
-
186
-
187
-
188
 |
 |

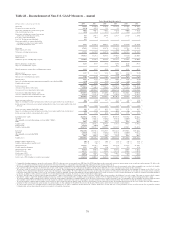
Table 22 – Reconcilement of Non-U.S. GAAP Measures – Annual
Twelve Months Ended December 31
(Dollars in millions, except per share and other data) 2008 2007 2006 2005 2004 2003
Net income $795.8 $1,634.0 $2,117.4 $1,987.2 $1,572.9 $1,332.3
Securities losses/(gains), net of tax (665.4) (150.7) 31.3 4.4 27.1 (80.5)
Net income excluding net securities losses/(gains) 130.4 1,483.3 2,148.7 1,991.6 1,600.0 1,251.8
Coke stock dividend, net of tax (49.8) (54.2) (53.3) (48.1) (43.0) (37.8)
Net income excluding net securities losses/(gains)
and the Coke stock dividend, net of tax 80.6 1,429.1 2,095.4 1,943.5 1,557.0 1,214.0
Less: Series A preferred dividends 22.3 30.3 7.7 - - -
Less: U.S. Treasury preferred dividends 26.6 -----
Net income available to common shareholders
excluding net securities losses/(gains) and the
Coke stock dividend, net of tax $31.7 $1,398.8 $2,087.7 $1,943.5 $1,557.0 $1,214.0
Net income $795.8 $1,634.0 $2,117.4 $1,987.2 $1,572.9 $1,332.3
Merger expense, net of tax ---61.1 18.5 -
Net income excluding merger expense $795.8 $1,634.0 $2,117.4 $2,048.3 $1,591.4 $1,332.3
Noninterest expense $5,890.4 $5,233.8 $4,879.9 $4,690.7 $3,897.0 $3,400.6
Merger expense ---(98.6) (28.4) -
Noninterest expense excluding merger expense $5,890.4 $5,233.8 $4,879.9 $4,592.1 $3,868.6 $3,400.6
Diluted earnings per common share $2.13 $4.55 $5.82 $5.47 $5.19 $4.73
Impact of excluding merger expense -- - 0.17 $0.06 -
Diluted earnings per common share excluding merger expense $2.13 $4.55 $5.82 $5.64 $5.25 $4.73
Efficiency ratio163.95 % 63.43 % 59.39 % 60.06 % 61.39 % 59.99%
Impact of excluding merger expense - - - (1.26) (0.45) -
Efficiency ratio excluding merger expense 63.95 % 63.43 % 59.39 % 58.80 % 60.94 % 59.99%
Efficiency ratio163.95 % 63.43 % 59.39 % 60.06 % 61.39 % 59.99%
Impact of excluding amortization/impairment of intangible assets other than MSRs (1.31) (1.17) (1.26) (1.52) (1.22) (1.13)
Tangible efficiency ratio262.64 % 62.26 % 58.13 % 58.54 % 60.17 % 58.86
Total average assets $175,848.3 $177,795.5 $180,315.1 $168,088.8 $133,754.3 $122,325.4
Average net unrealized securities gains (1,909.5) (2,300.8) (1,620.5) (1,949.4) (2,372.2) (2,343.0)
Average assets less net unrealized securities gains $173,938.8 $175,494.7 $178,694.6 $166,139.4 $131,382.1 $119,982.4
Total average common shareholders’ equity $17,530.7 $17,308.0 $17,394.7 $16,526.3 $11,469.5 $9,083.0
Average accumulated other comprehensive income (1,220.9) (1,143.3) (976.0) (1,220.5) (1,517.2) (1,486.1)
Total average realized common shareholders’ equity $16,309.8 $16,164.7 $16,418.7 $15,305.8 $9,952.3 $7,596.9
Return on average total assets 0.45 % 0.92 % 1.17 % 1.18 % 1.18 % 1.09 %
Impact of excluding net realized and unrealized securities losses/(gains) and the Coke stock dividend (0.40) (0.11) - (0.01) 0.01 (0.08)
Return on average total assets less net realized and unrealized securities losses/(gains) and the Coke stock
dividend 30.05 % 0.81 % 1.17 % 1.17 % 1.19 % 1.01 %
Return on average common shareholders’ equity 4.26 % 9.27 % 12.13 % 12.02 % 13.71 % 14.67 %
Impact of excluding net realized and unrealized securities losses/(gains) and the Coke stock dividend (4.07) (0.62) 0.59 0.68 1.94 1.31
Return on average realized common shareholders’ equity40.19 % 8.65 % 12.72 % 12.70 % 15.65 % 15.98 %
Total shareholders’ equity $22,388.1 $18,052.5 $17,813.6 $16,887.4 $15,986.9 $9,731.2
Goodwill (6,941.1) (6,921.5) (6,889.8) (6,835.1) (6,806.0) (1,077.7)
Other intangible assets including mortgage servicing rights (“MSRs”) (978.2) (1,308.6) (1,182.0) (1,123.0) (1,061.5) (639.6)
MSRs 810.5 1,049.4 810.5 657.6 482.4 449.3
Tangible equity 15,279.3 10,871.8 10,552.3 9,586.9 8,601.8 8,463.2
Preferred stock (5,221.7) (500.0) (500.0) - - -
Tangible common equity $10,057.6 $10,371.8 $10,052.3 $9,586.9 $8,601.8 $8,463.2
Total assets $189,138.0 $179,573.9 $182,161.6 $179,712.8 $158,869.8 $125,393.2
Goodwill (7,043.5) (6,921.5) (6,889.8) (6,835.1) (6,806.0) (1,077.7)
Other intangible assets including MSRs (1,035.4) (1,363.0) (1,182.0) (1,123.0) (1,061.5) (639.6)
MSRs 810.5 1,049.4 810.5 657.6 482.4 449.3
Tangible assets $181,869.6 $172,338.8 $174,900.3 $172,412.3 $151,484.7 $124,125.2
Tangible equity to tangible assets58.40 % 6.31 % 6.03 % 5.56 % 5.68 % 6.82 %
Tangible common equity to tangible assets65.53 % 6.02 % 5.75 % 5.56 % 5.68 % 6.82 %
Net interest income $4,619.7 $4,719.5 $4,660.4 $4,579.0 $3,685.2 $3,320.3
Taxable equivalent adjustment 117.5 102.7 88.0 75.5 58.4 45.0
Net interest income—FTE 4,737.2 4,822.2 4,748.4 4,654.5 3,743.6 3,365.3
Noninterest income 4,473.5 3,428.7 3,468.4 3,155.0 2,604.4 2,303.0
Total revenue—FTE 9,210.7 8,250.9 8,216.8 7,809.5 6,348.0 5,668.3
Securities losses/(gains), net (1,073.3) (243.1) 50.5 7.2 41.7 (123.9)
Total revenue—FTE excluding net securities losses/(gains)7$8,137.4 $8,007.8 $8,267.3 $7,816.7 $6,389.7 $5,544.4
1Computed by dividing noninterest expense by total revenue - FTE. The efficiency ratios are presented on an FTE basis. The FTE basis adjusts for the tax-favored status of net interest income from certain loans and investments. We believe this
measure to be the preferred industry measurement of net interest income and it enhances comparability of net interest income arising from taxable and tax-exempt sources.
2We present a tangible efficiency ratio which excludes the amortization/impairment of intangible assets other than MSRs. We believe this measure is useful to investors because, by removing the effect of these intangible asset costs (the level of which
may vary from company to company), it allows investors to more easily compare our efficiency to other companies in the industry. This measure is utilized by us to assess our efficiency and that of our lines of business.
3We present a return on average assets less net unrealized gains on securities. The foregoing numbers primarily reflect adjustments to remove the effects of the securities portfolio which includes our ownership of common stock of The Coca-Cola
Company. We use this information internally to gauge our actual performance in the industry. We believe that the return on average assets less the net unrealized securities gains is more indicative of our return on assets because it more accurately
reflects the return on the assets that are related to our core businesses which are primarily customer relationship and customer transaction driven. The return on average assets less net unrealized gains on securities is computed by dividing annualized
net income, excluding securities gains/losses and The Coca-Cola Company dividend, net of tax, by average assets less net unrealized securities gains.
4We believe that the return on average realized common shareholders’ equity is more indicative of our return on equity because the excluded equity relates primarily to the holding of a specific security. The return on average realized common
shareholders’ equity is computed by dividing annualized net income available to common shareholders, excluding securities gains/losses and The Coca-Cola Company dividend, net of tax, by average realized common shareholders’ equity.
5We present a tangible equity to tangible assets ratio that excludes the after-tax impact of purchase accounting intangible assets. We believe this measure is useful to investors because, by removing the effect of intangible assets that result from merger
and acquisition activity (the level of which may vary from company to company), it allows investors to more easily compare our capital adequacy to other companies in the industry. This measure is used by us to analyze capital adequacy.
6We present a tangible common equity to tangible assets ratio that excludes preferred stock from tangible equity. We believe this measure is useful to investors because, by removing the preferred stock (the level of which may vary from company to
company), it allows investors to more easily compare our capital adequacy to other companies in the industry who also use this measure. This measure is also used by us to analyze capital adequacy.
7We present total revenue- FTE excluding realized securities losses/(gains), net. We believe noninterest income without net securities (gains)/losses is more indicative of our performance because it isolates income that is primarily customer
relationship and customer transaction driven and is more indicative of normalized operations.
79