SunTrust 2008 Annual Report Download - page 56
Download and view the complete annual report
Please find page 56 of the 2008 SunTrust annual report below. You can navigate through the pages in the report by either clicking on the pages listed below, or by using the keyword search tool below to find specific information within the annual report.-
 1
1 -
2
-
3
-
4
-
5
-
6
-
7
-
8
-
9
-
10
-
11
-
12
-
13
-
14
-
15
-
16
-
17
-
18
-
19
-
20
-
21
-
22
-
23
-
24
-
25
-
26
-
27
-
28
-
29
-
30
-
31
-
32
-
33
-
34
-
35
-
36
-
37
-
38
-
39
-
40
-
41
-
42
-
43
-
44
-
45
-
 46
46 -
 47
47 -
 48
48 -
 49
49 -
 50
50 -
 51
51 -
 52
52 -
 53
53 -
 54
54 -
 55
55 -
 56
56 -
 57
57 -
 58
58 -
 59
59 -
 60
60 -
 61
61 -
 62
62 -
 63
63 -
 64
64 -
 65
65 -
 66
66 -
67
-
68
-
69
-
70
-
71
-
72
-
73
-
74
-
75
-
76
-
77
-
78
-
79
-
80
-
81
-
82
-
83
-
84
-
85
-
86
-
87
-
88
-
89
-
90
-
91
-
92
-
93
-
94
-
95
-
96
-
97
-
98
-
99
-
100
-
101
-
102
-
103
-
104
-
105
-
106
-
107
-
108
-
109
-
110
-
111
-
112
-
113
-
114
-
115
-
116
-
117
-
118
-
119
-
120
-
121
-
122
-
123
-
124
-
125
-
126
-
127
-
128
-
129
-
130
-
131
-
132
-
133
-
134
-
135
-
136
-
137
-
138
-
139
-
140
-
141
-
142
-
143
-
144
-
145
-
146
-
147
-
148
-
149
-
150
-
151
-
152
-
153
-
154
-
155
-
156
-
157
-
158
-
159
-
160
-
161
-
162
-
163
-
164
-
165
-
166
-
167
-
168
-
169
-
170
-
171
-
172
-
173
-
174
-
175
-
176
-
177
-
178
-
179
-
180
-
181
-
182
-
183
-
184
-
185
-
186
-
187
-
188
 |
 |

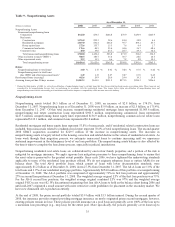
an appropriate value for similar ABS remaining in the portfolio. Sales, trading and settlement activity were scarce in the
fourth quarter of 2008; however, we maintained consistency in our pricing methodology and processes, and
incorporated any relevant changes to the valuation assumptions needed to ensure a supportable value for these illiquid
securities at December 31, 2008.
During 2008, we recognized through earnings $481.6 million in net trading and securities losses related to trading assets
and securities available for sale classified as level 3. While we believe we have utilized all pertinent market data in
establishing an appropriate fair value for our securities, current market conditions result in wide price ranges used to
evaluate market value. While it is difficult to accurately predict the ultimate cash value of these securities; we believe
the amount that would be ultimately realized if the securities were held to settlement or maturity will generally be
greater than the current fair value of the securities classified as level 3. This assessment is based on the current
performance of the underlying collateral, which is experiencing elevated losses but not to the degree that correlates to
current market values, which is pressured downward in this market due to liquidity issues and other broad
macroeconomic conditions. It is reasonably likely that this market volatility will continue as a result of a variety of
factors, including but not limited to economic conditions, the restructuring of SIVs, and third party sales of securities,
some of which could be large-scale.
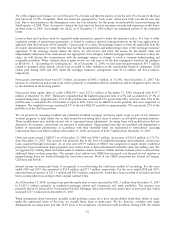
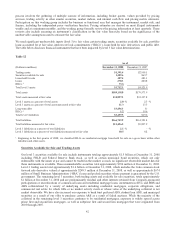
During the year ended December 31, 2008, we purchased $322.4 million of level 3 ABS, MBS, ARS and corporate debt,
including the $70 million Lehman Brothers bond, of which $270.0 million of ABS, MBS, ARS, and corporate debt was
classified as trading securities and $52.4 million of ARS was classified as securities available for sale. We also
purchased stock in the FHLB and Federal Reserve Bank of approximately $140.6 million, which is classified as level 3
available for sale securities. In addition, $39.1 million of trading ABS, $879.2 million of available for sale ABS, $669.9
million of SBA trading loans and pools and $3.6 billion of the public debt at fair value were transferred into level 3
during the year ended December 31, 2008 due to the absence of significant observable pricing data. Since the transfer
into level 3, we have purchased $145.0 million of SBA loans.
Loans and Loans Held for Sale
Level 3 loans are primarily non-agency residential mortgage loans held for investment or loans held for sale for which
there is little to no observable trading in either the new issuance or secondary loan markets as either whole loans or as
securities. Prior to the non-agency residential loan market disruption, which began during the third quarter of 2007 and
continues, we were able to obtain certain observable pricing from either the new issuance or secondary loan market.
However, as the markets deteriorated and certain loans were not actively trading as either whole loans or as securities,
we began employing the same alternative valuation methodologies used to value level 3 residential mortgage securities,
as described previously, to fair value the loans. We recognized $90.4 million and $15.6 million in net losses through
earnings during the years ended December 31, 2008 and 2007, respectively, related to level 3 loans and loans held for
sale, excluding IRLCs. During the years ended December 31, 2008 and 2007, we transferred $406.9 million and $716.0
million, respectively, of mortgage loans held for sale into level 3 due to the determination that there was no longer a
liquid market for valuing certain loan types.
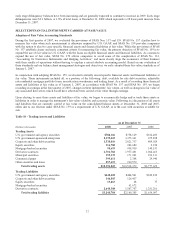
On May 1, 2008, we acquired 100% of the outstanding common shares of GB&T. We elected to account for $171.6
million of the acquired loans, which were classified as nonaccrual, at fair value in accordance with SFAS No. 159. Upon
acquisition, the loans had a fair value of $111.1 million. These loans are primarily commercial real estate loans which
do not trade in an active secondary market, and as such, are considered level 3 instruments. As these loans are all
classified as nonperforming, cash proceeds from the sale of the underlying collateral is the expected source of
repayment for the majority of these loans. In order to fair value these loans, we utilized market data, when available, as
well as internal assumptions, to derive fair value estimates of the underlying collateral. During the year ended
December 31, 2008, we recorded through earnings a loss of $4.2 million on these loans. On December 31, 2008,
primarily as a result of paydowns, payoffs, and transfers to OREO, the loans had a fair value of $31.2 million.
Derivatives
Most derivative instruments are level 1 or level 2 instruments, except for the IRLCs discussed below. In addition, the
equity forward agreements we entered into related to our investment in Coke common stock are level 3 instruments
within the fair value hierarchy of SFAS No. 157, due to the unobservability of a significant assumption used to value
these instruments. Because the value is primarily driven by the embedded equity collars on the Coke common shares, a
Black-Scholes model is the appropriate valuation model. Most of the assumptions are directly observable from the
market, such as the per share market price of Coke common stock, interest rates and the dividend rate on Coke common
stock. Volatility is a significant assumption and is impacted both by the unusually large size of the trade and the long
tenor until settlement. The derivatives carried scheduled terms of approximately six and a half and seven years from the
effective date, and as such, the observable and active options market on Coke does not provide for any identical or
44