SunTrust 2008 Annual Report Download - page 64
Download and view the complete annual report
Please find page 64 of the 2008 SunTrust annual report below. You can navigate through the pages in the report by either clicking on the pages listed below, or by using the keyword search tool below to find specific information within the annual report.-
 1
1 -
2
-
3
-
4
-
5
-
6
-
7
-
8
-
9
-
10
-
11
-
12
-
13
-
14
-
15
-
16
-
17
-
18
-
19
-
20
-
21
-
22
-
23
-
24
-
25
-
26
-
27
-
28
-
29
-
30
-
31
-
32
-
33
-
34
-
35
-
36
-
37
-
38
-
39
-
40
-
41
-
42
-
43
-
44
-
45
-
46
-
47
-
48
-
49
-
50
-
51
-
52
-
53
-
 54
54 -
 55
55 -
 56
56 -
 57
57 -
 58
58 -
 59
59 -
 60
60 -
 61
61 -
 62
62 -
 63
63 -
 64
64 -
 65
65 -
 66
66 -
 67
67 -
 68
68 -
 69
69 -
 70
70 -
 71
71 -
 72
72 -
 73
73 -
 74
74 -
75
-
76
-
77
-
78
-
79
-
80
-
81
-
82
-
83
-
84
-
85
-
86
-
87
-
88
-
89
-
90
-
91
-
92
-
93
-
94
-
95
-
96
-
97
-
98
-
99
-
100
-
101
-
102
-
103
-
104
-
105
-
106
-
107
-
108
-
109
-
110
-
111
-
112
-
113
-
114
-
115
-
116
-
117
-
118
-
119
-
120
-
121
-
122
-
123
-
124
-
125
-
126
-
127
-
128
-
129
-
130
-
131
-
132
-
133
-
134
-
135
-
136
-
137
-
138
-
139
-
140
-
141
-
142
-
143
-
144
-
145
-
146
-
147
-
148
-
149
-
150
-
151
-
152
-
153
-
154
-
155
-
156
-
157
-
158
-
159
-
160
-
161
-
162
-
163
-
164
-
165
-
166
-
167
-
168
-
169
-
170
-
171
-
172
-
173
-
174
-
175
-
176
-
177
-
178
-
179
-
180
-
181
-
182
-
183
-
184
-
185
-
186
-
187
-
188
 |
 |

We believe that effective management of operational risk – defined as the risk of loss resulting from inadequate or failed
internal processes, people and systems, or from external events – plays a major role in both the level and the stability of the
profitability of the institution. Our Operational Risk Management function oversees an enterprise-wide framework intended
to identify, assess, control, quantify, monitor, and report on operational risks company wide. These efforts support our goals
in seeking to minimize operational losses and strengthen our performance by optimizing operational capital allocation.
Operational Risk Management is overseen by our Chief Operational Risk Officer, who reports directly to the Chief Risk
Officer. The corporate governance structure also includes a risk manager and support staff embedded within each line of
business and corporate function. These risk managers also report indirectly to the Chief Operational Risk Officer and are
responsible for execution of the Operational Risk Management program within their areas.
Market Risk Management
Market risk refers to potential losses arising from changes in interest rates, foreign exchange rates, equity prices, commodity
prices and other relevant market rates or prices. Interest rate risk, defined as the exposure of net interest income and
Economic Value of Equity (“EVE”) to adverse movements in interest rates, is our primary market risk, and mainly arises
from the structure of the balance sheet. We are also exposed to market risk in our trading activities, MSRs, loan warehouse
and pipeline, and debt carried at fair value. The ALCO meets regularly and is responsible for reviewing our open positions
and establishing policies to monitor and limit exposure to market risk. The policies established by ALCO are reviewed and
approved by our Board of Directors.
Market Risk from Non-Trading Activities
The primary goal of interest rate risk management is to control exposure to interest rate risk, both within policy limits
approved by the Board and within narrower guidelines established by ALCO. These limits and guidelines reflect our
tolerance for interest rate risk over both short-term and long-term horizons.
The major sources of our non-trading interest rate risk are timing differences in the maturity and repricing characteristics of
assets and liabilities, changes in the shape of the yield curve, and the potential exercise of explicit or embedded options. We
measure these risks and their impact by identifying and quantifying exposures through the use of sophisticated simulation
and valuation models, as well as repricing gap analysis.
One of the primary methods that we use to quantify and manage interest rate risk is simulation analysis, which is used to
model net interest income from assets, liabilities, and derivative positions over a specified time period under various interest
rate scenarios and balance sheet structures. This analysis measures the sensitivity of net interest income over a two year time
horizon. Key assumptions in the simulation analysis (and in the valuation analysis discussed below) relate to the behavior of
interest rates and spreads, the changes in product balances and the behavior of loan and deposit clients in different rate
environments. This analysis incorporates several assumptions, the most material of which relate to the repricing
characteristics and balance fluctuations of deposits with indeterminate or non-contractual maturities.
As the future path of interest rates cannot be known in advance, we use simulation analysis to project net interest income
under various interest rate scenarios including implied forward and deliberately extreme and perhaps unlikely scenarios. The
analyses may include rapid and gradual ramping of interest rates, rate shocks, basis risk analysis, and yield curve twists. Each
analysis incorporates what management believes to be the most appropriate assumptions about customer behavior in an
interest rate scenario. Specific strategies are also analyzed to determine their impact on net interest income levels and
sensitivities.
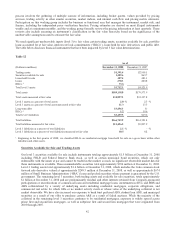
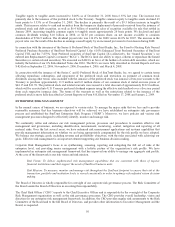
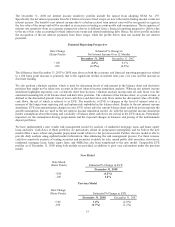
The sensitivity analysis included below is measured as a percentage change in net interest income due to an instantaneous
100 basis point move in benchmark interest rates. Estimated changes set forth below are dependent upon material
assumptions such as those previously discussed. The net interest income profile reflects asset sensitivity with respect to an
instantaneous 100 basis point change in rates.
Economic Perspective
Rate Change
(Basis Points)
Estimated % Change in
Net Interest Income Over 12 Months
December 31, 2008 December 31, 2007
+100 3.5% (1.0%)
-100 (0.1%) 0.3%
52