SunTrust 2008 Annual Report Download - page 43
Download and view the complete annual report
Please find page 43 of the 2008 SunTrust annual report below. You can navigate through the pages in the report by either clicking on the pages listed below, or by using the keyword search tool below to find specific information within the annual report.-
 1
1 -
2
-
3
-
4
-
5
-
6
-
7
-
8
-
9
-
10
-
11
-
12
-
13
-
14
-
15
-
16
-
17
-
18
-
19
-
20
-
21
-
22
-
23
-
24
-
25
-
26
-
27
-
28
-
29
-
30
-
31
-
32
-
 33
33 -
 34
34 -
 35
35 -
 36
36 -
 37
37 -
 38
38 -
 39
39 -
 40
40 -
 41
41 -
 42
42 -
 43
43 -
 44
44 -
 45
45 -
 46
46 -
 47
47 -
 48
48 -
 49
49 -
 50
50 -
 51
51 -
 52
52 -
 53
53 -
54
-
55
-
56
-
57
-
58
-
59
-
60
-
61
-
62
-
63
-
64
-
65
-
66
-
67
-
68
-
69
-
70
-
71
-
72
-
73
-
74
-
75
-
76
-
77
-
78
-
79
-
80
-
81
-
82
-
83
-
84
-
85
-
86
-
87
-
88
-
89
-
90
-
91
-
92
-
93
-
94
-
95
-
96
-
97
-
98
-
99
-
100
-
101
-
102
-
103
-
104
-
105
-
106
-
107
-
108
-
109
-
110
-
111
-
112
-
113
-
114
-
115
-
116
-
117
-
118
-
119
-
120
-
121
-
122
-
123
-
124
-
125
-
126
-
127
-
128
-
129
-
130
-
131
-
132
-
133
-
134
-
135
-
136
-
137
-
138
-
139
-
140
-
141
-
142
-
143
-
144
-
145
-
146
-
147
-
148
-
149
-
150
-
151
-
152
-
153
-
154
-
155
-
156
-
157
-
158
-
159
-
160
-
161
-
162
-
163
-
164
-
165
-
166
-
167
-
168
-
169
-
170
-
171
-
172
-
173
-
174
-
175
-
176
-
177
-
178
-
179
-
180
-
181
-
182
-
183
-
184
-
185
-
186
-
187
-
188
 |
 |

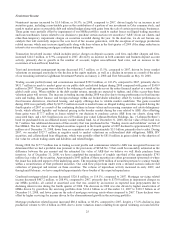
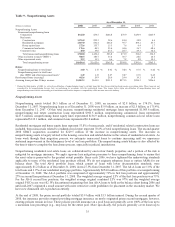
The indirect consumer portfolio was $6.5 billion, or 5.1% of total loans, at December 31, 2008, down $986.5 million, or
13.2%, from December 31, 2007. This portfolio primarily consists of automobile loans generated through dealerships and has
a current weighted average FICO of 699. The decrease is largely attributable to the recent slowdown in automobile sales and
our specific decision to reduce exposure in this portfolio. This portfolio is experiencing a higher level of net charge-offs
compared to the fourth quarter of 2007, driven by declining auto auction prices, especially for SUVs and large pick-up
trucks.
The direct consumer portfolio was $5.1 billion, or 4.0% of total loans, at December 31, 2008, up $1.2 billion, or 29.7% from
December 31, 2007, almost entirely due to growth in student loans. Student loans, which are mostly government supported,
made up $2.9 billion, or 55.4%, of the direct consumer portfolio. This portfolio also consists of loans and lines to individuals
for personal or family uses.
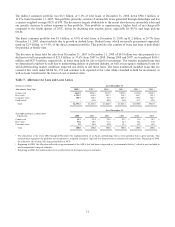
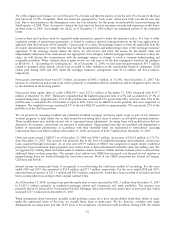
The decrease in loans held for sale from December 31, 2007 to December 31, 2008 of $4.8 billion was due primarily to a
decline in total loan production of $21.9 billion, or 37.6% from 2007 to 2008. During 2008 and 2007, we transferred $656.1
million and $837.4 million, respectively, in loans from held for sale to held for investment. The transfer included loans that
we determined could not be sold due to underwriting defects or payment defaults, as well as non-agency residential loans for
which deteriorating market conditions impacted our ability to sell these loans. The loans transferred included loans that are
carried at fair value under SFAS No. 159 and continue to be reported at fair value while classified as held for investment, as
well as loans transferred at the lower of cost or market value.
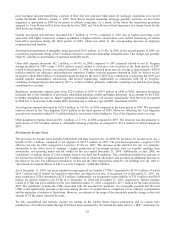
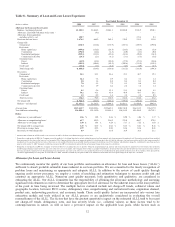
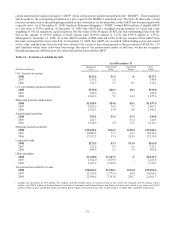
Table 7 - Allowance for Loan and Lease Losses
(Dollars in millions) As of December 31
Allocation by Loan Type 2008 12007 12006 12005 12004 12003 2
Commercial $631.2 $422.6 $415.9 $439.6 $433.0 $369.3
Real estate 1,523.2 664.6 443.1 394.1 369.7 159.3
Consumer loans 196.7 110.3 95.5 109.4 159.6 344.3
Unallocated 3-85.0 90.0 85.0 87.7 69.0
Total $2,351.1 $1,282.5 $1,044.5 $1,028.1 $1,050.0 $941.9
As of December 31
Year-end Loan Types as a Percent of
Total Loans 2008 2007 2006 2005 2004 2003
Commercial 32.3 % 29.4 % 28.8 % 29.2 % 31.6 % 38.2 %
Real estate 57.8 60.6 61.2 58.7 55.2 47.0
Consumer loans 9.9 10.0 10.0 12.1 13.2 14.8
Total 100.0 % 100.0 % 100.0 % 100.0 % 100.0 % 100.0 %
1The allocations in the years 2004 through 2008 reflect the implementation of an ALLL methodology that is more granular than in prior periods. This
methodology segregates the portfolio and incorporates a weighted average of expected loss derived from an internal risk rating system. Beginning in 2004,
the allocation also includes the acquired portfolio of NCF.
2Beginning in 2003, the allocation reflected an apportionment of the ALLL that had been categorized as “environmental factors,” which is now included in
our homogeneous loan pool estimates.
3Beginning in 2008, the unallocated reserve is reflected in our homogeneous pool estimates.
31