SunTrust 2008 Annual Report Download - page 45
Download and view the complete annual report
Please find page 45 of the 2008 SunTrust annual report below. You can navigate through the pages in the report by either clicking on the pages listed below, or by using the keyword search tool below to find specific information within the annual report.-
 1
1 -
2
-
3
-
4
-
5
-
6
-
7
-
8
-
9
-
10
-
11
-
12
-
13
-
14
-
15
-
16
-
17
-
18
-
19
-
20
-
21
-
22
-
23
-
24
-
25
-
26
-
27
-
28
-
29
-
30
-
31
-
32
-
33
-
34
-
 35
35 -
 36
36 -
 37
37 -
 38
38 -
 39
39 -
 40
40 -
 41
41 -
 42
42 -
 43
43 -
 44
44 -
 45
45 -
 46
46 -
 47
47 -
 48
48 -
 49
49 -
 50
50 -
 51
51 -
 52
52 -
 53
53 -
 54
54 -
 55
55 -
56
-
57
-
58
-
59
-
60
-
61
-
62
-
63
-
64
-
65
-
66
-
67
-
68
-
69
-
70
-
71
-
72
-
73
-
74
-
75
-
76
-
77
-
78
-
79
-
80
-
81
-
82
-
83
-
84
-
85
-
86
-
87
-
88
-
89
-
90
-
91
-
92
-
93
-
94
-
95
-
96
-
97
-
98
-
99
-
100
-
101
-
102
-
103
-
104
-
105
-
106
-
107
-
108
-
109
-
110
-
111
-
112
-
113
-
114
-
115
-
116
-
117
-
118
-
119
-
120
-
121
-
122
-
123
-
124
-
125
-
126
-
127
-
128
-
129
-
130
-
131
-
132
-
133
-
134
-
135
-
136
-
137
-
138
-
139
-
140
-
141
-
142
-
143
-
144
-
145
-
146
-
147
-
148
-
149
-
150
-
151
-
152
-
153
-
154
-
155
-
156
-
157
-
158
-
159
-
160
-
161
-
162
-
163
-
164
-
165
-
166
-
167
-
168
-
169
-
170
-
171
-
172
-
173
-
174
-
175
-
176
-
177
-
178
-
179
-
180
-
181
-
182
-
183
-
184
-
185
-
186
-
187
-
188
 |
 |
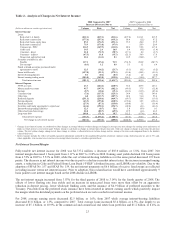
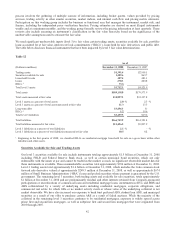
nonperforming or restructured loans tend to have a more isolated impact on subsets of loans in the loan pools. Also impacting
the ALLL is the estimated incurred loss period, which tends to be approximately one year for consumer-related loans and
between one and one-half to three years for wholesale-related loans. The ALLL process excludes loans measured at fair
value in accordance with SFAS No. 159, “The Fair Value Option for Financial Assets and Financial Liabilities—Including
an amendment of FASB Statement No. 115”, as subsequent mark to market adjustments related to loans measured at fair
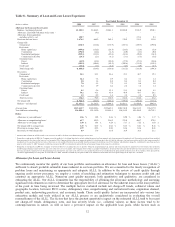
value include a credit risk component. At December 31, 2008, the ALLL was $2,351.1 million, which represented 1.86% of
period-end loans not carried at fair value. This compares with an ALLL of $1,282.5 million, or 1.05% of period-end loans
not carried at fair value, as of December 31, 2007. The increase in ALLL reflects decreasing home prices and the associated
increasing level of delinquencies, nonperforming loans, and net charge-offs in the residential real estate-related portions of
the loan portfolio. Also affecting the increase in the ALLL was $158.7 million added in conjunction with the GB&T
acquisition.
Our ALLL framework has two basic elements: specific allowances for loans individually evaluated for impairment and a
component for pools of homogeneous loans not individually evaluated. Beginning in 2008, the portion of the unallocated
allowance for inherent imprecision and incomplete data is reflected within the component for pools of homogenous loans.
The first element of the ALLL analysis involves the estimation of allowances specific to individual impaired loans. In this
process, specific allowances are established for larger commercial impaired loans based on an analysis of the most probable
sources of repayment, including discounted cash flows, liquidation of collateral, or the market value of the loan itself. As of
December 31, 2008 and 2007, the specific allowance related to impaired loans that were individually evaluated totaled
$148.7 million and $17.5 million, respectively. The increase in ALLL associated with impaired loans individually evaluated
is primarily driven by deterioration in loans to residential builders and several large credits within the Wholesale line of
business.
The second element of the ALLL, the general allowance for homogeneous loan pools not individually evaluated, is
determined by applying allowance factors to pools of loans within the portfolio that have similar risk characteristics. The
general allowance factors are determined using a baseline factor that is developed from an analysis of historical net
charge-off experience and expected losses. Expected losses are based on estimated probabilities of default and loss given
default derived from our internal risk rating process. These baseline factors are developed and applied to the various loan
pools. Adjustments may be made to baseline reserves for some of the loan pools based on an assessment of internal and
external influences on credit quality not fully reflected in the historical loss or risk-rating data. These influences may include
elements such as changes in credit underwriting, concentration risk, and/or recent observable asset quality trends. We
continually evaluate our ALLL methodology seeking to refine and enhance this process as appropriate, and it is likely that
the methodology will continue to evolve over time. As of December 31, 2008 and 2007, the general allowance calculations
totaled $2,202.4 million and $1,180.0 million, respectively. The increase was primarily due to declining home prices and the
associated deterioration in credit quality of the residential mortgage and home equity portfolios.
Our charge-off policy meets or exceeds regulatory minimums. Losses on unsecured consumer loans are recognized at 90
days past-due compared to the regulatory loss criteria of 120 days. Secured consumer loans, including residential real estate,
are typically charged-off between 120 and 180 days, depending on the collateral type, in compliance with Federal Financial
Institution Examination Council guidelines. Commercial loans and real estate loans are typically placed on nonaccrual when
principal or interest is past-due for 90 days or more unless the loan is both secured by collateral having realizable value
sufficient to discharge the debt in-full and the loan is in the legal process of collection. Accordingly, secured loans may be
charged-down to the estimated value of the collateral with previously accrued unpaid interest reversed. Subsequent charge-
offs may be required as a result of changes in the market value of collateral or other repayment prospects.
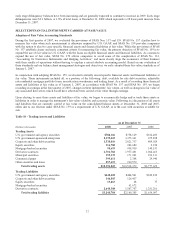
The ALLL recorded for real estate loans was $1,523.2 million, or 2.1% of total real estate loans. The increase in ALLL is
primarily associated with the residential mortgage, home equity, and residential construction portfolios and is primarily
resulting from decreasing home prices and borrower credit deterioration. The ALLL recorded for commercial loans was
$631.2 million, or 1.5% of the commercial loans, an increase of $208.6 million in 2008. The increase is primarily due to loan
growth and credit deterioration of several large credits in the Wholesale line of business.
The ratio of the ALLL to total nonperforming loans decreased to 61.7% as of December 31, 2008 from 101.9% as of
December 31, 2007. The decline in this ratio was due to a $2,509.6 million increase in nonperforming loans driven primarily
by increases in residential mortgage and real estate construction nonperforming loans, partially offset by the increase in the
ALLL. The increase in nonperforming loans was driven primarily by deteriorating economic conditions including increased
mortgage delinquency rates and declining home values in most markets that we serve. The product type of nonperforming
loans is a key determinant in evaluating the relationship between ALLL and nonperforming loans. We charge-off residential
nonperforming loans to the expected net realizable value of the loans sixty days after they are classified as nonperforming.
The charge-off is applied against the ALLL; therefore, the relationship between ALLL and nonperforming loans becomes
unlinked since the carrying value of many of the nonperforming loans has already recognized losses that are estimated to be
33