SunTrust 2008 Annual Report Download - page 84
Download and view the complete annual report
Please find page 84 of the 2008 SunTrust annual report below. You can navigate through the pages in the report by either clicking on the pages listed below, or by using the keyword search tool below to find specific information within the annual report.-
 1
1 -
2
-
3
-
4
-
5
-
6
-
7
-
8
-
9
-
10
-
11
-
12
-
13
-
14
-
15
-
16
-
17
-
18
-
19
-
20
-
21
-
22
-
23
-
24
-
25
-
26
-
27
-
28
-
29
-
30
-
31
-
32
-
33
-
34
-
35
-
36
-
37
-
38
-
39
-
40
-
41
-
42
-
43
-
44
-
45
-
46
-
47
-
48
-
49
-
50
-
51
-
52
-
53
-
54
-
55
-
56
-
57
-
58
-
59
-
60
-
61
-
62
-
63
-
64
-
65
-
66
-
67
-
68
-
69
-
70
-
71
-
72
-
73
-
 74
74 -
 75
75 -
 76
76 -
 77
77 -
 78
78 -
 79
79 -
 80
80 -
 81
81 -
 82
82 -
 83
83 -
 84
84 -
 85
85 -
 86
86 -
 87
87 -
 88
88 -
 89
89 -
 90
90 -
 91
91 -
 92
92 -
 93
93 -
 94
94 -
95
-
96
-
97
-
98
-
99
-
100
-
101
-
102
-
103
-
104
-
105
-
106
-
107
-
108
-
109
-
110
-
111
-
112
-
113
-
114
-
115
-
116
-
117
-
118
-
119
-
120
-
121
-
122
-
123
-
124
-
125
-
126
-
127
-
128
-
129
-
130
-
131
-
132
-
133
-
134
-
135
-
136
-
137
-
138
-
139
-
140
-
141
-
142
-
143
-
144
-
145
-
146
-
147
-
148
-
149
-
150
-
151
-
152
-
153
-
154
-
155
-
156
-
157
-
158
-
159
-
160
-
161
-
162
-
163
-
164
-
165
-
166
-
167
-
168
-
169
-
170
-
171
-
172
-
173
-
174
-
175
-
176
-
177
-
178
-
179
-
180
-
181
-
182
-
183
-
184
-
185
-
186
-
187
-
188
 |
 |

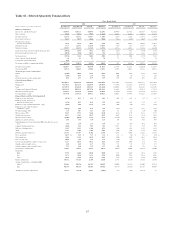
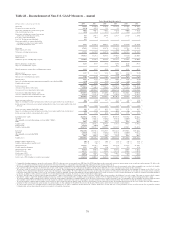
The following table for our reportable business segments compares net income for the twelve months ended December 31,
2008 to the same period in 2007 and 2006:
Table 20 – Net Income/(Loss) by Segment
Year Ended December 31
(Dollars in millions) 2008 2007 2006
Retail and Commercial $306.6 $790.5 $929.9
Wholesale 217.3 196.1 376.4
Mortgage (561.8) 5.4 242.8
Wealth and Investment Management 186.9 88.3 290.8
Corporate Other and Treasury 830.6 256.7 36.8
Reconciling Items (183.8) 297.0 240.8
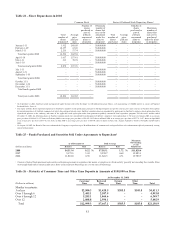
The following table for our reportable business segments compares average loans and average deposits for the year ended
December 31, 2008 to the same period in 2007 and 2006:
Table 21 – Average Loans and Deposits by Segment
Year Ended December 31
Average Loans Average Deposits
(Dollars in millions) 2008 2007 2006 2008 2007 2006
Retail and Commercial $51,148 $51,199 $50,497 $80,944 $80,153 $80,273
Wholesale 34,615 29,790 29,512 9,060 5,553 5,080
Mortgage 31,342 30,805 31,233 2,238 2,137 1,811
Wealth and Investment Management 8,109 7,965 8,135 9,563 9,781 9,477
Corporate Other and Treasury 236 356 294 14,370 22,277 27,149
BUSINESS SEGMENT RESULTS
Retail and Commercial
Retail and Commercial net income for the twelve months ended December 31, 2008 was $306.6 million, a decrease of
$483.9 million, or 61.2%, compared to the same period in 2007. This decrease was primarily the result of higher provision
for loan losses due to home equity line, consumer, indirect, and commercial loan net charge-offs, lower net interest income
related to deposit spreads and higher credit-related noninterest expense, partially offset by strong growth in service charges
on deposits.
Net interest income decreased $217.9 million, or 7.7%, driven by a continued shift in deposit mix and decreased spreads, as
deposit competition and the interest rate environment encouraged clients to migrate into higher yielding interest-bearing
deposits. Average deposit balances increased $0.8 billion, or 1.0%, while deposit spreads decreased 26 basis points resulting
in a $207.6 million decrease in net interest income. Low cost demand deposit and savings account average balances
decreased a combined $1.6 billion, or 8.1%, primarily due to decreases in commercial demand and savings. Higher cost
products such as NOW and money market increased a combined $2.3 billion, or 6.7%. Net interest income from loans
decreased $14.3 million, or 1.4%, as average loan balances declined $0.1 billion, or 0.1%. Growth in commercial loans,
equity lines, credit card, student loans, and loans acquired in conjunction with the GB&T transaction was offset by an
approximately $1.8 billion decline in average loan balances related to the migration of middle market clients from Retail and
Commercial to Wholesale.
Provision for loan losses increased $593.1 million over the same period in 2007. The provision increase was most
pronounced in home equity lines reflecting deterioration in the residential real estate market, while provision for loan losses
on consumer, indirect, and commercial loans, primarily to commercial clients with annual revenues of less than $5 million,
also increased.
Total noninterest income increased $102.6 million, or 8.2%, over the same period in 2007. This increase was driven
primarily by a $66.5 million, or 9.1%, increase in service charges on both consumer and business deposit accounts, primarily
due to growth in the number of accounts, higher nonsufficient funds (“NSF”) rates, and an increase in occurrences of NSF
fees. Interchange fees increased $24.5 million, or 12.1%, and ATM revenue increased $9.9 million, or 8.3%.
72