SunTrust 2008 Annual Report Download - page 49
Download and view the complete annual report
Please find page 49 of the 2008 SunTrust annual report below. You can navigate through the pages in the report by either clicking on the pages listed below, or by using the keyword search tool below to find specific information within the annual report.-
 1
1 -
2
-
3
-
4
-
5
-
6
-
7
-
8
-
9
-
10
-
11
-
12
-
13
-
14
-
15
-
16
-
17
-
18
-
19
-
20
-
21
-
22
-
23
-
24
-
25
-
26
-
27
-
28
-
29
-
30
-
31
-
32
-
33
-
34
-
35
-
36
-
37
-
38
-
 39
39 -
 40
40 -
 41
41 -
 42
42 -
 43
43 -
 44
44 -
 45
45 -
 46
46 -
 47
47 -
 48
48 -
 49
49 -
 50
50 -
 51
51 -
 52
52 -
 53
53 -
 54
54 -
 55
55 -
 56
56 -
 57
57 -
 58
58 -
 59
59 -
60
-
61
-
62
-
63
-
64
-
65
-
66
-
67
-
68
-
69
-
70
-
71
-
72
-
73
-
74
-
75
-
76
-
77
-
78
-
79
-
80
-
81
-
82
-
83
-
84
-
85
-
86
-
87
-
88
-
89
-
90
-
91
-
92
-
93
-
94
-
95
-
96
-
97
-
98
-
99
-
100
-
101
-
102
-
103
-
104
-
105
-
106
-
107
-
108
-
109
-
110
-
111
-
112
-
113
-
114
-
115
-
116
-
117
-
118
-
119
-
120
-
121
-
122
-
123
-
124
-
125
-
126
-
127
-
128
-
129
-
130
-
131
-
132
-
133
-
134
-
135
-
136
-
137
-
138
-
139
-
140
-
141
-
142
-
143
-
144
-
145
-
146
-
147
-
148
-
149
-
150
-
151
-
152
-
153
-
154
-
155
-
156
-
157
-
158
-
159
-
160
-
161
-
162
-
163
-
164
-
165
-
166
-
167
-
168
-
169
-
170
-
171
-
172
-
173
-
174
-
175
-
176
-
177
-
178
-
179
-
180
-
181
-
182
-
183
-
184
-
185
-
186
-
187
-
188
 |
 |
early stage delinquency balances have been increasing and are generally expected to continue to increase in 2009. Early stage
delinquencies were $2.3 billion, or 1.8% of total loans, at December 31, 2008 which represents a 28 basis point increase from
December 31, 2007.
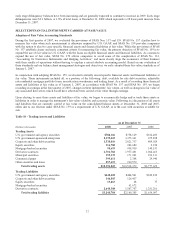
SELECTED FINANCIAL INSTRUMENTS CARRIED AT FAIR VALUE
Adoption of Fair Value Accounting Standards
During the first quarter of 2007, we evaluated the provisions of SFAS Nos. 157 and 159. SFAS No. 157 clarifies how to
measure fair value when such measurement is otherwise required by U.S. GAAP, and SFAS No. 159 provides companies
with the option to elect to carry specific financial assets and financial liabilities at fair value. While the provisions of SFAS
No. 157 establish clearer and more consistent criteria for measuring fair value, the primary objective of SFAS No. 159 is to
expand the use of fair value in U.S. GAAP, with the focus on eligible financial assets and financial liabilities. As a means to
expand the use of fair value, SFAS No. 159 allows companies to avoid some of the complexities of SFAS No. 133,
“Accounting for Derivative Instruments and Hedging Activities,” and more closely align the economics of their business
with their results of operations without having to explain a mixed attribute accounting model. Based on our evaluation of
these standards and our balance sheet management strategies and objectives, we early adopted these fair value standards as of
January 1, 2007.
In conjunction with adopting SFAS No. 159, we elected to initially record specific financial assets and financial liabilities at
fair value. These instruments included all, or a portion, of the following: debt, available for sale debt securities, adjustable
rate residential mortgage portfolio loans, securitization warehouses, and trading loans. As a result of recording these financial
assets and liabilities at fair value as of January 1, 2007, in accordance with SFAS No. 157 and SFAS No. 159, we began
recording in earnings in the first quarter of 2007, changes in these instruments’ fair values, as well as changes in fair value of
any associated derivatives which would have otherwise been carried at fair value through earnings.
Upon electing to carry these assets and liabilities at fair value, we began to economically hedge and/or trade these assets or
liabilities in order to manage the instrument’s fair value volatility and economic value. Following is a discussion of all assets
and liabilities that are currently carried at fair value on the consolidated balance sheets at December 31, 2008 and 2007,
either due to our election under SFAS No. 159 or a requirement of U.S. GAAP, as is the case with securities available for
sale.
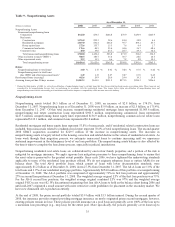
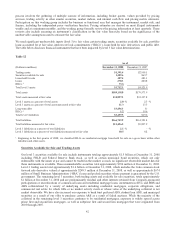
Table 10 - Trading Assets and Liabilities
As of December 31
(Dollars in thousands) 2008 2007 2006
Trading Assets
U.S. government and agency securities $788,166 $758,129 $162,403
U.S. government-sponsored enterprises 2,339,469 3,375,361 675,898
Corporate and other debt securities 1,538,010 2,821,737 409,029
Equity securities 116,788 242,680 2,254
Mortgage-backed securities 95,693 938,930 140,531
Derivative contracts 4,701,782 1,977,401 1,064,263
Municipal securities 159,135 171,203 293,311
Commercial paper 399,611 2,368 29,940
Other securities and loans 257,615 230,570 -
Total trading assets $10,396,269 $10,518,379 $2,777,629
Trading Liabilities
U.S. government and agency securities $440,408 $404,501 $382,819
Corporate and other debt securities 146,805 126,437 -
Equity securities 13,263 68 77
Mortgage-backed securities -61,672 -
Derivative contracts 2,640,308 1,567,707 1,251,201
Total trading liabilities $3,240,784 $2,160,385 $1,634,097
37