SunTrust 2008 Annual Report Download - page 46
Download and view the complete annual report
Please find page 46 of the 2008 SunTrust annual report below. You can navigate through the pages in the report by either clicking on the pages listed below, or by using the keyword search tool below to find specific information within the annual report.-
 1
1 -
2
-
3
-
4
-
5
-
6
-
7
-
8
-
9
-
10
-
11
-
12
-
13
-
14
-
15
-
16
-
17
-
18
-
19
-
20
-
21
-
22
-
23
-
24
-
25
-
26
-
27
-
28
-
29
-
30
-
31
-
32
-
33
-
34
-
35
-
 36
36 -
 37
37 -
 38
38 -
 39
39 -
 40
40 -
 41
41 -
 42
42 -
 43
43 -
 44
44 -
 45
45 -
 46
46 -
 47
47 -
 48
48 -
 49
49 -
 50
50 -
 51
51 -
 52
52 -
 53
53 -
 54
54 -
 55
55 -
 56
56 -
57
-
58
-
59
-
60
-
61
-
62
-
63
-
64
-
65
-
66
-
67
-
68
-
69
-
70
-
71
-
72
-
73
-
74
-
75
-
76
-
77
-
78
-
79
-
80
-
81
-
82
-
83
-
84
-
85
-
86
-
87
-
88
-
89
-
90
-
91
-
92
-
93
-
94
-
95
-
96
-
97
-
98
-
99
-
100
-
101
-
102
-
103
-
104
-
105
-
106
-
107
-
108
-
109
-
110
-
111
-
112
-
113
-
114
-
115
-
116
-
117
-
118
-
119
-
120
-
121
-
122
-
123
-
124
-
125
-
126
-
127
-
128
-
129
-
130
-
131
-
132
-
133
-
134
-
135
-
136
-
137
-
138
-
139
-
140
-
141
-
142
-
143
-
144
-
145
-
146
-
147
-
148
-
149
-
150
-
151
-
152
-
153
-
154
-
155
-
156
-
157
-
158
-
159
-
160
-
161
-
162
-
163
-
164
-
165
-
166
-
167
-
168
-
169
-
170
-
171
-
172
-
173
-
174
-
175
-
176
-
177
-
178
-
179
-
180
-
181
-
182
-
183
-
184
-
185
-
186
-
187
-
188
 |
 |
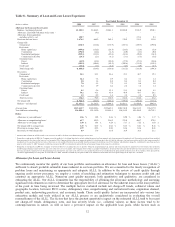
realized. Another factor that mitigates the increase in the ALLL is that most loans have some amount of realizable value;
therefore, while the entire loan is classified as nonperforming, only the amount of estimated losses would have been captured
in the ALLL.
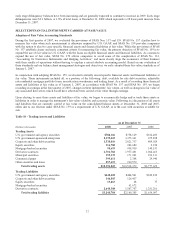
The reserve for unfunded commitments was $27.5 million and $7.9 million as of December 31, 2008 and 2007, respectively.
Lending commitments such as letters of credit and binding unfunded loan commitments are assessed similarly to unfunded
wholesale loans except utilization assumptions are considered. The reserve for unfunded lending commitments is included in
other liabilities on the Consolidated Balance Sheets with changes to the reserves recorded in other expense.
Net charge-offs for the year ended December 31, 2008 increased $1,141.5 million from the $422.8 million of net charge-offs
recorded in the prior year. The increase in net charge-offs was largely due to higher net charge-offs in the residential
mortgage, construction, and home equity portfolios. A downturn in residential real estate prices has negatively affected the
entire industry. Despite our avoidance of the subprime consumer real estate lending markets in our loan portfolio, the lower
residential real estate valuations and recessionary economic conditions have affected borrowers of higher credit quality as
well.
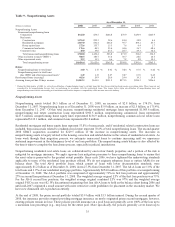
Provision for Loan Losses
The provision for loan losses is the result of a detailed analysis estimating an appropriate and adequate ALLL. The analysis
includes the evaluation of impaired loans as prescribed under SFAS No. 114 “Accounting by Creditors for Impairment of a
Loan,” and SFAS No. 118 “Accounting by Creditors for Impairment of a Loan – Income Recognition and Disclosures,” and
pooled loans and leases as prescribed under SFAS No. 5, “Accounting for Contingencies.” For the year ended December 31,
2008, the provision for loan losses was $2,474.2 million, an increase of $1,809.3 million, or 272.1%, from the year ended
December 31, 2007. Early stage delinquencies (accruing loans past due 30-89 days) were $2.3 billion, or 1.8% of total loans
at December 31, 2008, an increase of 28 basis points from December 31, 2007. Contributing to the increase in the provision
for loan losses were sharp declines in home values during 2008 with some of our Florida markets declining 30% while many
other markets declined 10% or less. Fourth quarter provision for loan losses increased $458.8 million from the third quarter
primarily due to significant deterioration in the economy and resulting deterioration in credit quality and higher fourth
quarter of 2008 net charge-offs. Fourth quarter credit quality deterioration was particularly evident in early stage
delinquencies which were stable most of 2008 around 1.5% of total loans but increased to 1.8% by year end due to an
intensification of recessionary conditions. The increase in early stage delinquencies was primarily in the residential mortgage
related portfolios.
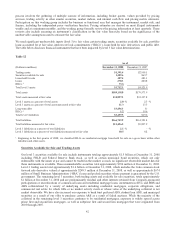
The provision for loan losses was $909.9 million more than net charge-offs of $1,564.3 million during 2008, reflecting the
downturn in the residential real estate markets and the resulting deterioration in credit conditions of the residential mortgage,
construction, and home equity portfolios. Net charge-offs for 2008 were $1,141.5 million higher than net charge-offs
recorded in 2007. Net charge-offs to average loans were 1.25% in 2008 compared to 0.35% in 2007. The increase was largely
due to higher net charge-offs in the residential mortgage, home equity, and construction portfolios. A downturn in residential
real estate prices has negatively affected the entire industry, including higher credit quality products and borrowers. We
anticipate declines in home values and rising unemployment will result in additional net charge-offs in future periods.
34