SunTrust 2008 Annual Report Download - page 116
Download and view the complete annual report
Please find page 116 of the 2008 SunTrust annual report below. You can navigate through the pages in the report by either clicking on the pages listed below, or by using the keyword search tool below to find specific information within the annual report.-
 1
1 -
2
-
3
-
4
-
5
-
6
-
7
-
8
-
9
-
10
-
11
-
12
-
13
-
14
-
15
-
16
-
17
-
18
-
19
-
20
-
21
-
22
-
23
-
24
-
25
-
26
-
27
-
28
-
29
-
30
-
31
-
32
-
33
-
34
-
35
-
36
-
37
-
38
-
39
-
40
-
41
-
42
-
43
-
44
-
45
-
46
-
47
-
48
-
49
-
50
-
51
-
52
-
53
-
54
-
55
-
56
-
57
-
58
-
59
-
60
-
61
-
62
-
63
-
64
-
65
-
66
-
67
-
68
-
69
-
70
-
71
-
72
-
73
-
74
-
75
-
76
-
77
-
78
-
79
-
80
-
81
-
82
-
83
-
84
-
85
-
86
-
87
-
88
-
89
-
90
-
91
-
92
-
93
-
94
-
95
-
96
-
97
-
98
-
99
-
100
-
101
-
102
-
103
-
104
-
105
-
 106
106 -
 107
107 -
 108
108 -
 109
109 -
 110
110 -
 111
111 -
 112
112 -
 113
113 -
 114
114 -
 115
115 -
 116
116 -
 117
117 -
 118
118 -
 119
119 -
 120
120 -
 121
121 -
 122
122 -
 123
123 -
 124
124 -
 125
125 -
 126
126 -
127
-
128
-
129
-
130
-
131
-
132
-
133
-
134
-
135
-
136
-
137
-
138
-
139
-
140
-
141
-
142
-
143
-
144
-
145
-
146
-
147
-
148
-
149
-
150
-
151
-
152
-
153
-
154
-
155
-
156
-
157
-
158
-
159
-
160
-
161
-
162
-
163
-
164
-
165
-
166
-
167
-
168
-
169
-
170
-
171
-
172
-
173
-
174
-
175
-
176
-
177
-
178
-
179
-
180
-
181
-
182
-
183
-
184
-
185
-
186
-
187
-
188
 |
 |

SUNTRUST BANKS, INC.
Notes to Consolidated Financial Statements (Continued)
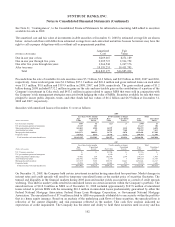
The average recorded investment in certain impaired loans for the years ended December 31, 2008, 2007, and 2006 was
$1,021.7 million, $130.4 million, and $131.7 million, respectively. For 2008, 2007, and 2006, interest income recognized on
certain impaired loans totaled $23.1 million, $8.6 million, and $10.6 million, respectively.
During 2008 and 2007, the Company transferred $656.1 million and $837.4 million, respectively, in loans held for sale to
loans held for investment in response to liquidity issues in the market with respect to these loans. The loans transferred
included loans carried at fair value under SFAS No. 159 which continue to be reported at fair value while classified as held
for investment, as well as loans transferred at the lower of cost or market which had associated write-downs of $35.4 million
and $27.2 million during 2008 and 2007, respectively. At December 31, 2008 and 2007, $33.6 billion and $36.1 billion,
respectively, of loans were pledged as collateral for borrowings.
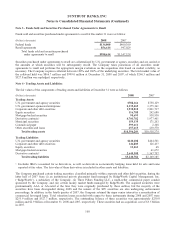
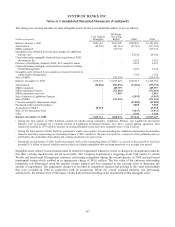
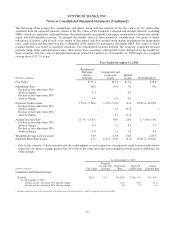
Note 7 - Allowance for Loan and Lease Losses
Activity in the allowance for loan and lease losses for the year ended December 31 is summarized in the table below:
(Dollars in thousands) 2008 2007 2006
Balance at beginning of year $1,282,504 $1,044,521 $1,028,128
Allowance associated with loans at fair value 1-(4,100) -
Allowance from GB&T acquisition 158,705 --
Provision for loan losses 2,474,215 664,922 262,536
Loan charge-offs (1,680,552) (514,348) (356,569)
Loan recoveries 116,124 91,509 110,426
Balance at end of year $2,350,996 $1,282,504 $1,044,521
1Amount removed from the allowance for loan losses related to the Company’s election to record $4.1 billion of residential
mortgages at fair value.
Note 8 - Premises and Equipment
Premises and equipment at December 31 were as follows:
(Dollars in thousands) Useful Life 2008 2007
Land Indefinite $399,657 $382,066
Buildings and improvements 2 -40 years 894,534 1,002,105
Leasehold improvements 1 -30 years 509,736 481,877
Furniture and equipment 1 -20 years 1,376,403 1,381,130
Construction in progress 164,968 163,119
3,345,298 3,410,297
Less accumulated depreciation and amortization 1,797,406 1,814,606
Total premises and equipment $1,547,892 $1,595,691
During 2007, the Company completed multiple sale/leaseback transactions, consisting of over 300 of the Company’s branch
properties and various individual office buildings. In total, the Company sold and concurrently leased back $545.9 million in
land and buildings with associated accumulated depreciation of $285.7 million. Net proceeds were $764.4 million, resulting
in a gain, net of transaction costs, of $504.2 million. For the year ended December 31, 2007, the Company recognized $118.8
million of the gain immediately. The remaining $385.4 million in gains were deferred and are being recognized ratably over
the expected term of the respective leases, predominantly 10 years, as an offset to net occupancy expense.
During 2008, the Company completed sale/leaseback transactions, consisting of 152 branch properties and various individual
office buildings. In total, the Company sold and concurrently leased back $201.9 million in land and buildings with
associated accumulated depreciation of $110.3 million. Net proceeds were $288.9 million, resulting in a gross gain, net of
transaction costs, of $197.3 million. For the year ended December 31, 2008, the Company recognized $37.0 million of the
gain immediately. The remaining $160.3 million in gains were deferred and are being recognized ratably over the expected
term of the respective leases, predominantly 10 years, as an offset to net occupancy expense.
104