SunTrust 2008 Annual Report Download - page 60
Download and view the complete annual report
Please find page 60 of the 2008 SunTrust annual report below. You can navigate through the pages in the report by either clicking on the pages listed below, or by using the keyword search tool below to find specific information within the annual report.-
 1
1 -
2
-
3
-
4
-
5
-
6
-
7
-
8
-
9
-
10
-
11
-
12
-
13
-
14
-
15
-
16
-
17
-
18
-
19
-
20
-
21
-
22
-
23
-
24
-
25
-
26
-
27
-
28
-
29
-
30
-
31
-
32
-
33
-
34
-
35
-
36
-
37
-
38
-
39
-
40
-
41
-
42
-
43
-
44
-
45
-
46
-
47
-
48
-
49
-
 50
50 -
 51
51 -
 52
52 -
 53
53 -
 54
54 -
 55
55 -
 56
56 -
 57
57 -
 58
58 -
 59
59 -
 60
60 -
 61
61 -
 62
62 -
 63
63 -
 64
64 -
 65
65 -
 66
66 -
 67
67 -
 68
68 -
 69
69 -
 70
70 -
71
-
72
-
73
-
74
-
75
-
76
-
77
-
78
-
79
-
80
-
81
-
82
-
83
-
84
-
85
-
86
-
87
-
88
-
89
-
90
-
91
-
92
-
93
-
94
-
95
-
96
-
97
-
98
-
99
-
100
-
101
-
102
-
103
-
104
-
105
-
106
-
107
-
108
-
109
-
110
-
111
-
112
-
113
-
114
-
115
-
116
-
117
-
118
-
119
-
120
-
121
-
122
-
123
-
124
-
125
-
126
-
127
-
128
-
129
-
130
-
131
-
132
-
133
-
134
-
135
-
136
-
137
-
138
-
139
-
140
-
141
-
142
-
143
-
144
-
145
-
146
-
147
-
148
-
149
-
150
-
151
-
152
-
153
-
154
-
155
-
156
-
157
-
158
-
159
-
160
-
161
-
162
-
163
-
164
-
165
-
166
-
167
-
168
-
169
-
170
-
171
-
172
-
173
-
174
-
175
-
176
-
177
-
178
-
179
-
180
-
181
-
182
-
183
-
184
-
185
-
186
-
187
-
188
 |
 |

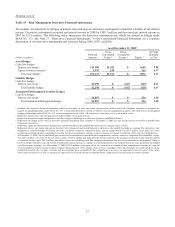
partially offset by declines in savings, noninterest bearing DDA, and consumer time account balances. Savings accounts
declined $0.8 billion, or 18.2%, noninterest bearing DDA declined $0.7 billion, or 3.4%, and consumer time accounts
declined $0.2 billion, or 1.0%. The decline in these products was the result of deposit migration to higher cost money market
accounts reflecting consumer sentiment favoring liquidity, safety and soundness, and higher rates than traditional checking
and savings products.
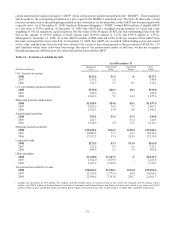
Average brokered and foreign deposits decreased by $7.1 billion, or 3.3%, during 2008 compared to 2007. The decrease was
due to our efforts to reduce our reliance upon wholesale funding sources and may continue to decline in 2009 due to recent
alternative funding sources. Consumer and commercial deposit growth is one of our key initiatives, as we focus on deposit
gathering opportunities across all lines of business throughout the geographic footprint. Initiatives to attract deposits included
the “My Cause” campaign which provides enrollment incentives to depositors, the modification of incentive plans to place
greater emphasis on deposit and package account sales, enhancing online banking products, and partnering with other well
known brands in deposit oriented promotions. We also significantly improved our pricing process and product structure in
2008, which provided us with enhanced capability to price our products differentially across different parts of our footprint.
Despite the larger mix of higher cost deposit products, primarily driven by market dynamics, this enhancement was critical as
we not only lowered our interest expense on deposits, but also grew customer deposits during 2008. The “My Cause”
campaign, which generated over 1.1 million checking accounts during 2008, ended in the fourth quarter of 2008, and we
launched the “Live Solid. Bank Solid.” branding and marketing campaign to improve our visibility in the marketplace. It is
designed to speak to what is important to clients in the current environment and to inspire customer loyalty and capitalize on
some of the opportunities presented by the new banking landscape. As of December 31, 2008 securities pledged as collateral
for deposits totaled $6.2 billion.
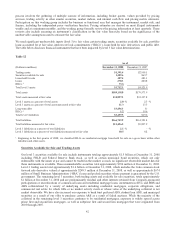
OTHER SHORT-TERM BORROWINGS AND LONG-TERM DEBT
Other short-term borrowings increased $2.1 billion, or 71.0%, from December 31, 2007 to $5.2 billion at December 31, 2008.
The change in other short-term borrowings was primarily a result of our participation in the Federal Reserve’s (“Fed”) TAF
in November and December of 2008. The Fed announced in October that it would offer expanded TAF funds availability
during the fourth quarter of 2008. We purchased $2.5 billion in three-month funding under the TAF in support of the Fed’s
initiative.
Long-term debt increased $3.9 billion, or 16.8%, from December 31, 2007 to $26.8 billion at December 31, 2008. The
change in long-term debt was primarily the result of our participation, in December, in the FDIC’s TLGP under which we
issued $3.0 billion in debt that was guaranteed by the FDIC under the terms of the program. Our decision to participate in the
program was a result of being able to obtain a lower cost funding source than other borrowing channels available to us as a
result of the guarantee provided on the issued debt by the U.S. government agency. We have approximately $1.0 billion in
capacity remaining under this program and are reasonably likely to issue the additional $1.0 billion in long-term debt under
the program during the first or second quarter of 2009.
CAPITAL RESOURCES
Table 14 – Capital Ratios
As of December 31
(Dollars in millions) 2008 2007 2006 2005 2004 2003
Tier 1 capital1$17,613.7 $11,424.9 $12,524.7 $11,079.8 $9,783.7 $8,930.0
Total capital 22,743.4 16,994.1 18,024.9 16,713.6 14,152.6 13,365.9
Risk-weighted assets 162,046.4 164,931.9 162,236.7 158,132.3 136,642.8 113,711.3
Risk-based ratios:
Tier 1 capital 10.87 % 6.93 % 7.72 % 7.01 % 7.16 % 7.85 %
Total capital 14.04 10.30 11.11 10.57 10.36 11.75
Tier 1 leverage ratio 10.45 6.90 7.23 6.65 6.64 7.37
Total shareholders’ equity to assets 11.84 10.05 9.78 9.40 10.06 7.76
1Tier 1 capital includes trust preferred obligations of $2.8 billion at the end of 2008, $2.1 billion at the end of 2007, $2.4 billion at the end of 2006, $1.9 billion at the end of 2005 and 2004,
and $1.7 billion at the end of 2003. Tier 1 capital also includes qualifying minority interests in consolidated subsidiaries of $102 million at the end of 2008, $105 million at the end of 2007,
$455 million at the end of 2006, $467 million at the end of 2005, $451 million at the end of 2004 and 2003.
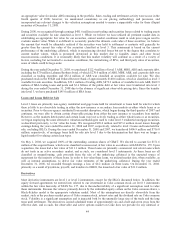
Our primary regulator, the Federal Reserve, measures capital adequacy within a framework that makes capital requirements
sensitive to the risk profiles of individual banking companies. The guidelines weigh assets and off balance sheet risk
exposures (risk weighted assets) according to predefined classifications, creating a base from which to compare capital
levels. Tier 1 Capital primarily includes realized equity and qualified preferred instruments, less purchase accounting
intangibles such as goodwill and core deposit intangibles. Total Capital consists of Tier 1 Capital and Tier 2 Capital, which
includes qualifying portions of subordinated debt, allowance for loan losses up to a maximum of 1.25% of risk weighted
assets, and 45% of the unrealized gain on equity securities.
48