SunTrust 2008 Annual Report Download - page 114
Download and view the complete annual report
Please find page 114 of the 2008 SunTrust annual report below. You can navigate through the pages in the report by either clicking on the pages listed below, or by using the keyword search tool below to find specific information within the annual report.-
 1
1 -
2
-
3
-
4
-
5
-
6
-
7
-
8
-
9
-
10
-
11
-
12
-
13
-
14
-
15
-
16
-
17
-
18
-
19
-
20
-
21
-
22
-
23
-
24
-
25
-
26
-
27
-
28
-
29
-
30
-
31
-
32
-
33
-
34
-
35
-
36
-
37
-
38
-
39
-
40
-
41
-
42
-
43
-
44
-
45
-
46
-
47
-
48
-
49
-
50
-
51
-
52
-
53
-
54
-
55
-
56
-
57
-
58
-
59
-
60
-
61
-
62
-
63
-
64
-
65
-
66
-
67
-
68
-
69
-
70
-
71
-
72
-
73
-
74
-
75
-
76
-
77
-
78
-
79
-
80
-
81
-
82
-
83
-
84
-
85
-
86
-
87
-
88
-
89
-
90
-
91
-
92
-
93
-
94
-
95
-
96
-
97
-
98
-
99
-
100
-
101
-
102
-
103
-
 104
104 -
 105
105 -
 106
106 -
 107
107 -
 108
108 -
 109
109 -
 110
110 -
 111
111 -
 112
112 -
 113
113 -
 114
114 -
 115
115 -
 116
116 -
 117
117 -
 118
118 -
 119
119 -
 120
120 -
 121
121 -
 122
122 -
 123
123 -
 124
124 -
125
-
126
-
127
-
128
-
129
-
130
-
131
-
132
-
133
-
134
-
135
-
136
-
137
-
138
-
139
-
140
-
141
-
142
-
143
-
144
-
145
-
146
-
147
-
148
-
149
-
150
-
151
-
152
-
153
-
154
-
155
-
156
-
157
-
158
-
159
-
160
-
161
-
162
-
163
-
164
-
165
-
166
-
167
-
168
-
169
-
170
-
171
-
172
-
173
-
174
-
175
-
176
-
177
-
178
-
179
-
180
-
181
-
182
-
183
-
184
-
185
-
186
-
187
-
188
 |
 |

SUNTRUST BANKS, INC.
Notes to Consolidated Financial Statements (Continued)
See Note 21, “Contingencies”, to the Consolidated Financial Statements for information concerning ARS added to securities
available for sale in 2008.
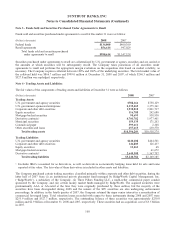
The amortized cost and fair value of investments in debt securities at December 31, 2008 by estimated average life are shown
below. Actual cash flows will differ from estimated average lives and contractual maturities because borrowers may have the
right to call or prepay obligations with or without call or prepayment penalties.
(Dollars in thousands)
Amortized
Cost
Fair
Value
Due in one year or less $269,667 $271,189
Due in one year through five years 2,905,715 2,934,752
Due after five years through ten years 3,264,544 3,267,576
After ten years 10,395,251 10,411,705
Total $16,835,177 $16,885,222
Proceeds from the sale of available for sale securities were $5.7 billion, $1.2 billion, and $4.9 billion in 2008, 2007 and 2006,
respectively. Gross realized gains were $1.2 billion, $251.1 million and $69.4 million and gross realized losses on such sales
were $1.3 million, $8.0 million and $119.9 million in 2008, 2007, and 2006, respectively. The gross realized gains of $1.2
billion during 2008 included $732.2 million in gains on the sale and non-taxable gain on the contribution of a portion of the
Company’s investment in Coke stock and $413.1 million in gains related to agency MBS that were sold in conjunction with
the Company’s risk management strategies associated with hedging the value of MSRs. Securities available for sale that were
pledged to secure public deposits, trusts, and other funds had fair values of $6.2 billion and $6.9 billion at December 31,
2008 and 2007, respectively.
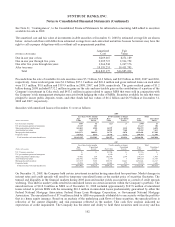
Securities with unrealized losses at December 31 were as follows:
2008
Less than twelve months Twelve months or longer Total
Fair Unrealized Fair Unrealized Fair Unrealized
(Dollars in thousands) Value Losses Value Losses Value Losses
U.S. Treasury securities $367 $1 $23 $- $390 $1
U.S. government-sponsored enterprises 43,217 301 - - 43,217 301
States and political subdivisions 169,693 4,980 14,879 1,118 184,572 6,098
Asset-backed securities 3,153 65 16,029 7,568 19,182 7,633
Mortgage-backed securities 3,804,972 108,919 24,712 9,070 3,829,684 117,989
Corporate bonds 140,513 6,836 28,944 6,158 169,457 12,994
Total securities with unrealized losses $4,161,915 $121,102 $84,587 $23,914 $4,246,502 $145,016
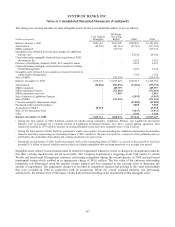
2007
Less than twelve months Twelve months or longer Total
(Dollars in thousands)
Fair
Value
Unrealized
Losses Fair Value
Unrealized
Losses
Fair
Value
Unrealized
Losses
U.S. Treasury securities $- $- $1,726 $- $1,726 $-
U.S. government-sponsored enterprises 41 - 8,242 1 8,283 1
States and political subdivisions 47,666 264 102,888 1,189 150,554 1,453
Asset-backed securities 202,766 31,380 1,344 3 204,110 31,383
Mortgage-backed securities 683,475 5,104 808,551 11,223 1,492,026 16,327
Corporate bonds 43,954 1,370 32,001 279 75,955 1,649
Total securities with unrealized losses $977,902 $38,118 $954,752 $12,695 $1,932,654 $50,813
On December 31, 2008, the Company held certain investment securities having unrealized loss positions. Market changes in
interest rates and credit spreads will result in temporary unrealized losses as the market price of securities fluctuates. The
turmoil and illiquidity in the financial markets during 2008 increased market yields on securities as a result of credit spreads
widening. This shift in market yields resulted in unrealized losses on certain securities within the Company’s portfolio. The
unrealized loss of $118.0 million in MBS as of December 31, 2008 included approximately $107.8 million of unrealized
losses related to private MBS with the remaining $10.2 million in unrealized losses predominantly guaranteed by either the
Federal National Mortgage Association, Federal Home Loan Mortgage Corporation, or Government National Mortgage
Association. The unrealized loss of $7.6 million related to ABS was primarily attributable to one security within the portfolio
that is a home equity issuance. Based on an analysis of the underlying cash flows of these securities, the unrealized loss is
reflective of the current illiquidity and risk premiums reflected in the market. This cash flow analysis indicated no
expectation of credit impairment. The Company has the intent and ability to hold these securities until recovery and has
102