SunTrust 2008 Annual Report Download - page 48
Download and view the complete annual report
Please find page 48 of the 2008 SunTrust annual report below. You can navigate through the pages in the report by either clicking on the pages listed below, or by using the keyword search tool below to find specific information within the annual report.-
 1
1 -
2
-
3
-
4
-
5
-
6
-
7
-
8
-
9
-
10
-
11
-
12
-
13
-
14
-
15
-
16
-
17
-
18
-
19
-
20
-
21
-
22
-
23
-
24
-
25
-
26
-
27
-
28
-
29
-
30
-
31
-
32
-
33
-
34
-
35
-
36
-
37
-
 38
38 -
 39
39 -
 40
40 -
 41
41 -
 42
42 -
 43
43 -
 44
44 -
 45
45 -
 46
46 -
 47
47 -
 48
48 -
 49
49 -
 50
50 -
 51
51 -
 52
52 -
 53
53 -
 54
54 -
 55
55 -
 56
56 -
 57
57 -
 58
58 -
59
-
60
-
61
-
62
-
63
-
64
-
65
-
66
-
67
-
68
-
69
-
70
-
71
-
72
-
73
-
74
-
75
-
76
-
77
-
78
-
79
-
80
-
81
-
82
-
83
-
84
-
85
-
86
-
87
-
88
-
89
-
90
-
91
-
92
-
93
-
94
-
95
-
96
-
97
-
98
-
99
-
100
-
101
-
102
-
103
-
104
-
105
-
106
-
107
-
108
-
109
-
110
-
111
-
112
-
113
-
114
-
115
-
116
-
117
-
118
-
119
-
120
-
121
-
122
-
123
-
124
-
125
-
126
-
127
-
128
-
129
-
130
-
131
-
132
-
133
-
134
-
135
-
136
-
137
-
138
-
139
-
140
-
141
-
142
-
143
-
144
-
145
-
146
-
147
-
148
-
149
-
150
-
151
-
152
-
153
-
154
-
155
-
156
-
157
-
158
-
159
-
160
-
161
-
162
-
163
-
164
-
165
-
166
-
167
-
168
-
169
-
170
-
171
-
172
-
173
-
174
-
175
-
176
-
177
-
178
-
179
-
180
-
181
-
182
-
183
-
184
-
185
-
186
-
187
-
188
 |
 |
5% of the original pool balance; we cover the next 3% of losses and then the insurer covers the next 2% of losses to the final
stop loss level of 10%. Frequently, these loss limits are segregated by “book years” where each book year has its own stop
loss. Due to deterioration in the delinquency rates, the loss estimates for the prime second portfolio increased during the
fourth quarter of 2008. Thus, we expect to breach the first stop loss level on our prime seconds and experience credit losses
on these loans in 2009. Accordingly, the ALLL as of December 31, 2008 reflects our uninsured portion of the estimated
losses.
Loans in these pool policies must be originated under parameters agreed to under the insurance policy. If a loan is either
originated outside of agreed upon parameters, or found to contain a material misrepresentation on the loan application or
appraisal, then the loan may not be insurable. Upon receipt of a claim, the mortgage insurer reviews the applicable loan file
for proper documentation to verify that the loan met the documentation and underwriting terms of the mortgage insurance
agreement. If the mortgage insurer denies the claim, we will review and verify the reason for the denied claim and
independently determine if the claim denial was appropriate. If we disagree with the mortgage insurer’s decision to deny the
claim, we will discuss the circumstances with the mortgage insurer in attempt to reach a common understanding and
acceptable resolution. When a denied claim is under review, we will reserve for the loss contingency based on the guidance
in SFAS No. 5, “Accounting for Contingencies”. As of December 31, 2008, we had reserved approximately $97.5 million
related to potential claim denials, which were recorded in other liabilities in the consolidated financial statements. Total
claims paid during 2008 and 2007 under the mortgage insurance arrangement were $31.4 million and $41.4 million,
respectively.
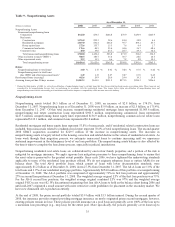
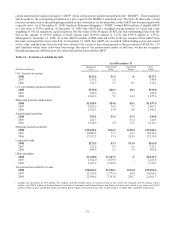
Nonaccrual construction loans were $1.3 billion, an increase of $981.5 million, or 332.4%, from December 31, 2007. The
increase in construction nonaccrual loans relates primarily to residential-related construction and development and is driven
by the downturn in the housing market.
Nonaccrual home equity lines of credit (“HELOC”) were $272.6 million at December 31, 2008 compared with $135.7
million at December 31, 2007. Third-party originated had the highest nonaccrual ratio at 4.3% and accounted for 29.3% of
nonperforming lines. Approximately 11% of the portfolio has combined LTVs greater than 90%, and more than 54% of the
portfolio has a combined LTV of less than or equal to 80%. There are no HELOCs in the portfolio that were originated as
subprime. The weighted average combined LTV of the total HELOC portfolio is approximately 74% and nearly 23% of the
portfolio is in the first lien position.
We are proactively managing troubled and potentially-troubled mortgage and home equity loans as part of our extensive
workout programs to help clients stay in their homes by reworking these loans to achieve an affordable payment structure.
These modifications may include interest rate or repayment terms adjustments. Accruing loans with modifications that are
deemed to be economic concessions are reported as restructured. Nonaccruing loans that are modified and demonstrate a
history of repayment performance in accordance with their modified terms are reclassified to restructured. Accruing
restructured loans were $462.6 million at December 31, 2008, an increase of $432.7 million from December 31, 2007.
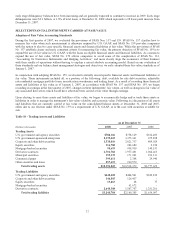
Other real estate owned (“OREO”) as of December 31, 2008 was $500.5 million, an increase of $316.8 million, or 172.5%,
from December 31, 2007. The increase was primarily due to the level of residential mortgage and residential construction
loans acquired through foreclosure. As of year end, $335.9 million of OREO was comprised of single family residential
properties. Upon foreclosure, these properties were written down to their estimated net realizable value, less selling costs. We
are aggressively working these foreclosed assets to minimize losses; however, further declines in home prices could result in
additional losses on these properties. The amount of net inflows into OREO has increased over the past several quarters as
nonperforming loans are worked through the foreclosure process. Most of our OREO properties are located in Georgia,
California and Florida.
Interest income on nonaccrual loans, if recognized, is recorded using the cash basis method of accounting. For the years
ended 2008 and 2007, this amounted to $25.4 million and $17.3 million, respectively. For the years ended 2008 and 2007,
estimated interest income of $233.3 million and $85.0 million, respectively, would have been recorded if all such loans had
been accruing interest according to their original contract terms.
As of December 31, 2008, accruing loans past due ninety days or more increased by $421.3 million from December 31, 2007
to $1,032.3 million, primarily in residential mortgage related and commercial real estate portfolios. The increase was
primarily driven by loans sold to Government National Mortgage Association that were ninety days or more past due, which
increased $257.3 million from December 31, 2007.
When information about borrowers’ possible credit problems causes us to have serious doubts about their ability to repay
under the contractual terms of the loan, we classify those loans as nonaccrual. We do, however, consider early stage
delinquencies (accruing loans past due 30-89 days) to be an indicator of potential credit problems. During 2008, the related
36