SunTrust 2008 Annual Report Download - page 149
Download and view the complete annual report
Please find page 149 of the 2008 SunTrust annual report below. You can navigate through the pages in the report by either clicking on the pages listed below, or by using the keyword search tool below to find specific information within the annual report.-
 1
1 -
2
-
3
-
4
-
5
-
6
-
7
-
8
-
9
-
10
-
11
-
12
-
13
-
14
-
15
-
16
-
17
-
18
-
19
-
20
-
21
-
22
-
23
-
24
-
25
-
26
-
27
-
28
-
29
-
30
-
31
-
32
-
33
-
34
-
35
-
36
-
37
-
38
-
39
-
40
-
41
-
42
-
43
-
44
-
45
-
46
-
47
-
48
-
49
-
50
-
51
-
52
-
53
-
54
-
55
-
56
-
57
-
58
-
59
-
60
-
61
-
62
-
63
-
64
-
65
-
66
-
67
-
68
-
69
-
70
-
71
-
72
-
73
-
74
-
75
-
76
-
77
-
78
-
79
-
80
-
81
-
82
-
83
-
84
-
85
-
86
-
87
-
88
-
89
-
90
-
91
-
92
-
93
-
94
-
95
-
96
-
97
-
98
-
99
-
100
-
101
-
102
-
103
-
104
-
105
-
106
-
107
-
108
-
109
-
110
-
111
-
112
-
113
-
114
-
115
-
116
-
117
-
118
-
119
-
120
-
121
-
122
-
123
-
124
-
125
-
126
-
127
-
128
-
129
-
130
-
131
-
132
-
133
-
134
-
135
-
136
-
137
-
138
-
 139
139 -
 140
140 -
 141
141 -
 142
142 -
 143
143 -
 144
144 -
 145
145 -
 146
146 -
 147
147 -
 148
148 -
 149
149 -
 150
150 -
 151
151 -
 152
152 -
 153
153 -
 154
154 -
 155
155 -
 156
156 -
 157
157 -
 158
158 -
 159
159 -
160
-
161
-
162
-
163
-
164
-
165
-
166
-
167
-
168
-
169
-
170
-
171
-
172
-
173
-
174
-
175
-
176
-
177
-
178
-
179
-
180
-
181
-
182
-
183
-
184
-
185
-
186
-
187
-
188
 |
 |

SUNTRUST BANKS, INC.
Notes to Consolidated Financial Statements (Continued)
an asset to the Company and zero if such net value is a liability to the Company. As of December 31, 2008, net derivative
asset positions to which the Company was exposed to risk of its counterparties were $3.5 billion, representing the net of $4.6
billion in net derivative gains by counterparty, netted by counterparty where formal netting arrangements exist, adjusted for
collateral of $1.1 billion that the Company holds in relation to these gain positions. As of December 31, 2007, net derivative
asset positions to which the Company was exposed to risk of its counterparties were $1.4 billion, representing the net of $1.9
billion in derivative gains, netted by counterparty where formal netting arrangements exist, adjusted for collateral of $0.5
billion that the Company holds in relation to these gain positions. The Company adjusted the net fair value of its derivative
contracts based on the estimated credit risk of $23.1 million and $6.9 million as of December 31, 2008 and 2007,
respectively. See Note 20, “Fair Value Election and Measurement,” to the Consolidated Financial Statements for more
information on how these credit risk adjustments are determined. Many derivative financial instruments contain credit risk
related contingent features that may require the posting of additional collateral in association with, or even immediate
settlement of, outstanding positions when certain triggering events occur.
Derivatives also expose the Company to market risk. Market risk is the adverse effect that a change in interest rates, currency
rates, equity prices or implied volatility has on the value of a derivative. The Company manages the market risk associated
with its derivatives by establishing and monitoring limits on the types and degree of risk that may be undertaken. The
Company continually measures this risk by using a VaR methodology.
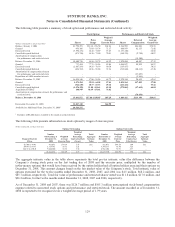
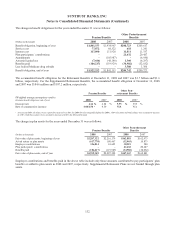
The Company’s derivative positions as of December 31 were as follows:
2008 2007
Contract or Notional Amount Contract or Notional Amount
(Dollars in millions) End User For Clients End User For Clients
Derivatives contracts
Interest rate contracts
Swaps $20,193 $126,913 $23,068 $89,379
Futures and forwards 10,089 40,057 24,330 23,802
Options 1,500 28,098 1,800 16,936
Total interest rate contracts 31,782 195,068 49,198 130,117
Interest rate lock commitments 7,161 - 4,993 -
Equity contracts 3,094 11,214 - 10,293
Foreign exchange contracts 2,009 5,659 2,293 4,763
Other derivative contracts 345 1,671 1,101 77
Total derivatives contracts $44,391 $213,612 $57,585 $145,250
Credit-related arrangements
Commitments to extend credit $79,191 $83,165
Standby letters of credit and similar arrangements 13,942 12,703
Total credit-related arrangements $93,133 $95,868
Fair Value and Cash Flow Hedges
The Company utilizes a comprehensive risk management strategy to monitor sensitivity of earnings to movements in interest
rates. Specific types of funding and principal amounts hedged are determined based on prevailing market conditions and the
shape of the yield curve. In conjunction with this strategy, the Company employs various interest rate derivatives as risk
management tools to hedge interest rate risk from recognized assets and liabilities or from forecasted transactions. The terms
and notional amounts of derivatives are determined based on management’s assessment of future interest rates, as well as
other factors. The Company establishes parameters for derivative usage, including identification of assets and liabilities to
hedge, derivative instruments to be utilized, and notional amounts of hedging relationships.
Fair Value Hedges
Prior to the adoption of SFAS No. 159 in 2007, the Company had designated interest rate swaps as fair value hedges of
changes in the fair value of recognized liabilities due to changes in the benchmark interest rate pursuant to the
provisions of SFAS No. 133. For the year ended December 31, 2006, the Company recognized $64.7 million of interest
137