SunTrust 2008 Annual Report Download - page 57
Download and view the complete annual report
Please find page 57 of the 2008 SunTrust annual report below. You can navigate through the pages in the report by either clicking on the pages listed below, or by using the keyword search tool below to find specific information within the annual report.-
 1
1 -
2
-
3
-
4
-
5
-
6
-
7
-
8
-
9
-
10
-
11
-
12
-
13
-
14
-
15
-
16
-
17
-
18
-
19
-
20
-
21
-
22
-
23
-
24
-
25
-
26
-
27
-
28
-
29
-
30
-
31
-
32
-
33
-
34
-
35
-
36
-
37
-
38
-
39
-
40
-
41
-
42
-
43
-
44
-
45
-
46
-
 47
47 -
 48
48 -
 49
49 -
 50
50 -
 51
51 -
 52
52 -
 53
53 -
 54
54 -
 55
55 -
 56
56 -
 57
57 -
 58
58 -
 59
59 -
 60
60 -
 61
61 -
 62
62 -
 63
63 -
 64
64 -
 65
65 -
 66
66 -
 67
67 -
68
-
69
-
70
-
71
-
72
-
73
-
74
-
75
-
76
-
77
-
78
-
79
-
80
-
81
-
82
-
83
-
84
-
85
-
86
-
87
-
88
-
89
-
90
-
91
-
92
-
93
-
94
-
95
-
96
-
97
-
98
-
99
-
100
-
101
-
102
-
103
-
104
-
105
-
106
-
107
-
108
-
109
-
110
-
111
-
112
-
113
-
114
-
115
-
116
-
117
-
118
-
119
-
120
-
121
-
122
-
123
-
124
-
125
-
126
-
127
-
128
-
129
-
130
-
131
-
132
-
133
-
134
-
135
-
136
-
137
-
138
-
139
-
140
-
141
-
142
-
143
-
144
-
145
-
146
-
147
-
148
-
149
-
150
-
151
-
152
-
153
-
154
-
155
-
156
-
157
-
158
-
159
-
160
-
161
-
162
-
163
-
164
-
165
-
166
-
167
-
168
-
169
-
170
-
171
-
172
-
173
-
174
-
175
-
176
-
177
-
178
-
179
-
180
-
181
-
182
-
183
-
184
-
185
-
186
-
187
-
188
 |
 |

similar instruments. As a result, we receive estimated market values from a market participant who is knowledgeable
about Coke equity derivatives and is active in the market. Based on inquiries of the market participant as to their
procedures as well as our own valuation assessment procedures, we have satisfied ourselves that the market participant
is using methodologies and assumptions that other market participants would use in arriving at the fair value of the
Agreements. At December 31, 2008, the Agreements were in an asset position to us of approximately $249.5 million.
The fair value of our IRLCs, while based on interest rates observable in the market, is highly dependent on the ultimate
closing of the loans. These “pull-through” rates are based on our historical data and reflect an estimate of the likelihood
that a commitment will ultimately result in a closed loan. As a result of the adoption of SEC Staff Accounting Bulletin
(“SAB”) No. 109, servicing value, beginning in the first quarter of 2008, was also included in the fair value of IRLCs.
The fair value of MSRs is determined by projecting cash flows which are then discounted to estimate an expected fair
value. The fair value of MSRs is impacted by a variety of factors, including prepayment assumptions, discount rates,
delinquency rates, contractual specified servicing fees and underlying portfolio characteristics. Because these inputs are
not transparent in market trades, MSRs are considered to be level 3 assets in the valuation hierarchy.
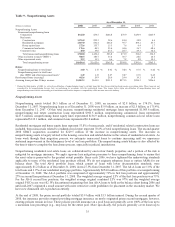
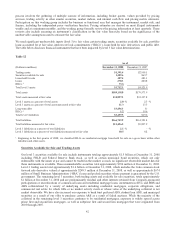
Long Term Debt
We have elected to carry at fair value $3.6 billion (par) of our publicly-issued, fixed rate debt. The debt consists of a
number of different issuances that carry coupon rates ranging from 5.00% to 7.75%, resulting in a weighted-average rate
of 5.93%, and maturities from May 1, 2010 through April 1, 2020, resulting in a weighted-average life of 5.9 years.
During the years ended December 31, 2008 and 2007, we recognized net gains of $431.7 million and $140.9 million,
respectively, in trading gains associated with the fair value changes in the debt and related derivatives and trading
securities that provide an economic offset to the change in the value of the debt. Credit spreads widened throughout
2008 in connection with the continued deterioration of the broader financial markets and a number of failures in the
financial services industry. Further fluctuations in our credit spreads are likely to occur in the future based on instrument
specific and broader market conditions.
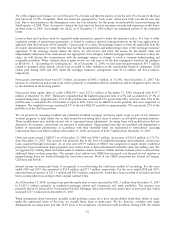
To mitigate the prospective impact of spread tightening, we completed the repurchase of a portion of our fair value debt
of approximately $386.6 million during the year ended December 31, 2008. We also hold approximately $166.1 million
of fixed rate corporate bonds referencing financial services companies to provide some level of offset to the changes in
our credit spreads. We entered into pay fixed/receive float interest rate swaps to offset the changes in fair value of those
corporate bonds due to interest rate movement. To mitigate the impact of fair value changes on our debt due to interest
rate movement, we generally enter into interest rate swaps; however, at times, we may also purchase fixed rate agency
MBS to achieve this offset in interest rates. There were no agency MBS held as of December 31, 2008 for this purpose.
See the “Trading Assets and Liabilities” section included in the MD&A for more information. We value this debt by
obtaining quotes from a third party pricing service and utilizing broker quotes to corroborate the reasonableness of those
market values. In addition, information from market data of recent observable trades and indications from buy side
investors, if available, are taken into consideration as additional support for the mark. During the third and fourth
quarters of 2008, there were few trades to reference, and therefore, given the continued lack of liquidity for these types
of instruments, both in the secondary markets and for primary issuances, this debt was transferred from a level 2 to a
level 3 classification in the fair value hierarchy effective July 1, 2008.
Overall, the financial impact of the level 3 financial instruments did not have a significant impact on our liquidity or capital.
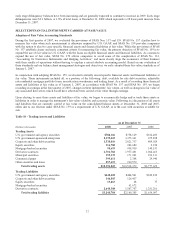
We acquired certain ABS from affiliates during the fourth quarter of 2007 using our existing liquidity position, and since
purchasing the securities, we have received approximately $2.4 billion in cash consideration from paydowns, settlements,
sales and maturities of these securities. For the year ended December 31, 2008, we recognized $624.6 million in net losses
through earnings due to the change in the fair value of level 3 assets and liabilities, excluding IRLCs. Some fair value assets
are pledged for corporate borrowings or other liquidity purposes. Most of these arrangements provide for advances to be
made based on the market value and not the principal balance of the assets, and therefore whether or not we have elected fair
value accounting treatment does not impact our liquidity. If the fair value of assets posted as collateral declines, we will be
required to post more collateral under our borrowing arrangements which could negatively impact our liquidity position on
an overall basis. For purposes of computing regulatory capital, mark to market adjustments related to our own
creditworthiness for debt accounted for at fair value are excluded from regulatory capital.
45