SunTrust 2008 Annual Report Download - page 42
Download and view the complete annual report
Please find page 42 of the 2008 SunTrust annual report below. You can navigate through the pages in the report by either clicking on the pages listed below, or by using the keyword search tool below to find specific information within the annual report.-
 1
1 -
2
-
3
-
4
-
5
-
6
-
7
-
8
-
9
-
10
-
11
-
12
-
13
-
14
-
15
-
16
-
17
-
18
-
19
-
20
-
21
-
22
-
23
-
24
-
25
-
26
-
27
-
28
-
29
-
30
-
31
-
 32
32 -
 33
33 -
 34
34 -
 35
35 -
 36
36 -
 37
37 -
 38
38 -
 39
39 -
 40
40 -
 41
41 -
 42
42 -
 43
43 -
 44
44 -
 45
45 -
 46
46 -
 47
47 -
 48
48 -
 49
49 -
 50
50 -
 51
51 -
 52
52 -
53
-
54
-
55
-
56
-
57
-
58
-
59
-
60
-
61
-
62
-
63
-
64
-
65
-
66
-
67
-
68
-
69
-
70
-
71
-
72
-
73
-
74
-
75
-
76
-
77
-
78
-
79
-
80
-
81
-
82
-
83
-
84
-
85
-
86
-
87
-
88
-
89
-
90
-
91
-
92
-
93
-
94
-
95
-
96
-
97
-
98
-
99
-
100
-
101
-
102
-
103
-
104
-
105
-
106
-
107
-
108
-
109
-
110
-
111
-
112
-
113
-
114
-
115
-
116
-
117
-
118
-
119
-
120
-
121
-
122
-
123
-
124
-
125
-
126
-
127
-
128
-
129
-
130
-
131
-
132
-
133
-
134
-
135
-
136
-
137
-
138
-
139
-
140
-
141
-
142
-
143
-
144
-
145
-
146
-
147
-
148
-
149
-
150
-
151
-
152
-
153
-
154
-
155
-
156
-
157
-
158
-
159
-
160
-
161
-
162
-
163
-
164
-
165
-
166
-
167
-
168
-
169
-
170
-
171
-
172
-
173
-
174
-
175
-
176
-
177
-
178
-
179
-
180
-
181
-
182
-
183
-
184
-
185
-
186
-
187
-
188
 |
 |
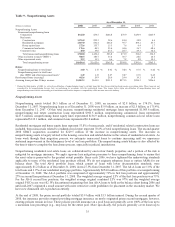
Residential mortgages were $32.1 billion, or 25.2% of the total loan portfolio, as of December 31, 2008, down 2.2% from
December 31, 2007. The residential mortgage portfolio is comprised of core mortgages (prime first liens), prime second lien
mortgages, home equity loans, lot loans, and Alt-A first and second mortgages. There are minimal negative amortizing
option adjustable rate mortgages (“ARMs”) and virtually no subprime loans in the core portfolio. The residential portfolio is
mainly dispersed over four states: Florida (29.9%), Georgia (15.2%), Virginia (10.5%), and California (8.0%). The core
mortgage portfolio was $23.2 billion, or 18.2% of total loans, as of December 31, 2008 and deteriorated somewhat due to
current market conditions. Delinquency levels of 60 days or more increased to 2.6% as of December 31, 2008. The core
mortgage portfolio consists of two-thirds prime jumbo loans. The core first mortgage portfolio included $14.3 billion in
interest-only ARMs. The weighted average combined loan to value (“LTV”) at origination of the core portfolio was 73%,
and the portfolio has a current weighted average FICO score of 721. Prime second mortgages were $3.9 billion, or 3.1%, of
total loans as of December 31, 2008 and are comprised of purchase money second liens or combo loans with a current
weighted average FICO of 708. Home equity loans comprise $2.5 billion, or 2.0%, of the total loan portfolio as of
December 31, 2008 and have a current weighted average FICO score of 713 and a 75% weighted average combined LTV at
origination. Thirty-two percent of the home equity loans are in a first lien position. Lot loans were $1.4 billion, or
approximately 1.1% of total loans, as of December 31, 2008 and have a current weighted average FICO score of 700. Alt-A
loans were $1.2 billion, or 1.0% of total loans, as of December 31, 2008. Of the Alt-A loans, $0.9 billion are first liens and
well secured with a weighted average combined LTV of 75% at origination. The remaining $0.3 billion of Alt-A loans are
second lien loans with a weighted average combined LTV of 97% at origination and a current weighted average FICO score
of 601.
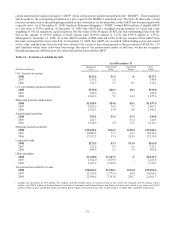
The home equity line portfolio was $16.5 billion, or 13.0% of total loans, as of December 31, 2008, an increase of 10.3%
from December 31, 2007, and it has a 74% weighted average combined LTV at origination and current FICO score of 727.
The growth in this portfolio is in the low risk segment and results from a slow down of payoff/paydown attrition and normal
line utilization on lines originated in late 2007 and 2008 under more conservative underwriting guidelines. The growth was
predominantly in the less than 90% LTV and higher than 720 FICO scores segments. The weighted average FICO score of
our new production is 772 with a weighted average combined LTV of 60%. Third party originated home equity lines
continue to perform poorly; however, only 11.3% of the home equity lines were originated through that channel. We have
eliminated origination of home equity product through third party channels, eliminated greater than 85% LTV originations,
implemented market specific LTV guidelines in certain declining markets, and have been aggressively reducing line
commitments in higher risk situations. Approximately 23% of our home equity lines are in a first lien position. We continue
to enhance our collections and default management processes and where possible, reduce outstanding line commitments;
however, we expect the home equity line portfolio to continue to show elevated nonaccrual and charge-off levels in the near
future.
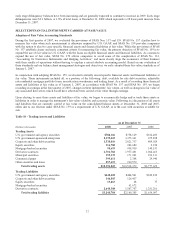
The construction portfolio was $9.9 billion, or 7.8% of total loans, at December 31, 2008, down $3.9 billion, or 28.4%, from
December 31, 2007. The construction portfolio consists of residential construction to perm loans ($1.7 billion), residential
construction loans ($2.0 billion), commercial construction loans ($2.4 billion), acquisition and development loans ($2.5
billion), and raw land loans ($1.3 billion). Approximately one third of this portfolio is owner-occupied, which provides
additional sources of repayment and helps mitigate risk of loss. We have reduced the level of risk in the construction
portfolio by prudently managing our construction exposure. This is evident by the declines in outstanding balances since
December 2007 in the construction to perm (down 52.0%), residential construction (down 27.7%), commercial construction
(down 27.1%), and acquisition and development (down 14.0%) portfolios. Further, these net decreases include the addition
of construction loans from the GB&T acquisition that occurred in the second quarter 2008. Commercial-related construction
loans represent 24.3% of the total construction portfolio and continue to perform well. Overall performance of residential
construction related loans has deteriorated since the fourth quarter of 2007 consistent with the general decline in the
economy. We continue to be proactive in our credit monitoring and management processes to provide early warning for
problem loans in the portfolio. For example, we use an expanded liquidity and contingency analysis to provide a thorough
view of borrower capacity and their ability to service obligations in a steep market decline. We have strict limits and have
exposure caps on specific projects and borrowers for risk diversification. In some cases, the maturity date of certain
residential real estate related loans, namely construction to perm and lot loans, has been extended as a result of market delays
in completing the build-out phase of the home. These borrowers continue to perform; consequently, the loans remain on
accruing status. It is possible that these borrowers could experience varying degrees of financial difficulties, resulting
potentially in more significant loan modifications.
The commercial real estate portfolio was $15.0 billion, or 11.8% of total loans, an increase of $2.3 billion, or 18.6%, from
December 31, 2007. Of this increase, $603.4 million was due to the acquisition of GB&T. This portfolio includes both
owner-occupied and income producing collateral, with approximately 60% being owner occupied properties. The primary
source of loan repayment for owner-occupied properties is business income and not real estate operations, which diversifies
the risk or sources of repayment. Although we have not seen a significant deterioration on the fundamentals in our income
property or owner-occupied products, recent market conditions have presented some rising vacancies among retail, office,
and industrial products.
30