SunTrust 2008 Annual Report Download - page 37
Download and view the complete annual report
Please find page 37 of the 2008 SunTrust annual report below. You can navigate through the pages in the report by either clicking on the pages listed below, or by using the keyword search tool below to find specific information within the annual report.-
 1
1 -
2
-
3
-
4
-
5
-
6
-
7
-
8
-
9
-
10
-
11
-
12
-
13
-
14
-
15
-
16
-
17
-
18
-
19
-
20
-
21
-
22
-
23
-
24
-
25
-
26
-
 27
27 -
 28
28 -
 29
29 -
 30
30 -
 31
31 -
 32
32 -
 33
33 -
 34
34 -
 35
35 -
 36
36 -
 37
37 -
 38
38 -
 39
39 -
 40
40 -
 41
41 -
 42
42 -
 43
43 -
 44
44 -
 45
45 -
 46
46 -
 47
47 -
48
-
49
-
50
-
51
-
52
-
53
-
54
-
55
-
56
-
57
-
58
-
59
-
60
-
61
-
62
-
63
-
64
-
65
-
66
-
67
-
68
-
69
-
70
-
71
-
72
-
73
-
74
-
75
-
76
-
77
-
78
-
79
-
80
-
81
-
82
-
83
-
84
-
85
-
86
-
87
-
88
-
89
-
90
-
91
-
92
-
93
-
94
-
95
-
96
-
97
-
98
-
99
-
100
-
101
-
102
-
103
-
104
-
105
-
106
-
107
-
108
-
109
-
110
-
111
-
112
-
113
-
114
-
115
-
116
-
117
-
118
-
119
-
120
-
121
-
122
-
123
-
124
-
125
-
126
-
127
-
128
-
129
-
130
-
131
-
132
-
133
-
134
-
135
-
136
-
137
-
138
-
139
-
140
-
141
-
142
-
143
-
144
-
145
-
146
-
147
-
148
-
149
-
150
-
151
-
152
-
153
-
154
-
155
-
156
-
157
-
158
-
159
-
160
-
161
-
162
-
163
-
164
-
165
-
166
-
167
-
168
-
169
-
170
-
171
-
172
-
173
-
174
-
175
-
176
-
177
-
178
-
179
-
180
-
181
-
182
-
183
-
184
-
185
-
186
-
187
-
188
 |
 |
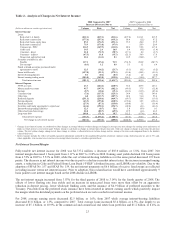
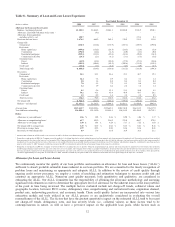
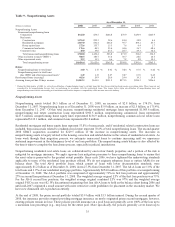
Noninterest Income
Noninterest income increased by $1.0 billion, or 30.5%, in 2008, compared to 2007, driven largely by an increase in net
securities gains, including a non-taxable gain on the contribution of a portion of our investment in Coke common stock, and
mark to market gains on our public debt and related hedges along with gains from the sale of certain non-strategic businesses.
These gains were partially offset by impairment of our MSRs portfolio, mark to market losses on illiquid trading securities
and loan warehouses, losses related to our decision to purchase certain auction rate securities (“ARS”) from our clients, and
other-than-temporary impairment charges on securities recorded during the year. In the short-run, we do not foresee any
catalysts that will materially improve the core level of fee income generation, with the exception of mortgage production
related income, which may increase significantly along with loan volume in the first quarter of 2009 if the sharp reduction in
interest rates on conforming mortgages continues during the quarter.
Transaction fee-related income, which includes service charges on deposit accounts, card fees, and other charges and fees,
increased $141.5 million, or 8.9%, compared to 2007, driven by an increase in both consumer and business deposit account
activity, primarily due to growth in the number of accounts, higher non-sufficient fund rates, and an increase in the
occurrence of non-sufficient fund fees.
Trust and investment management income decreased $92.7 million, or 13.5%, compared to 2007, driven by lower market
valuations on managed assets due to the decline in the equity markets, as well as a decline in revenue as a result of the sales
of our remaining interest in Lighthouse Investment Partners on January 2, 2008 and First Mercantile on May 30, 2008.
Trading account profits/(losses) and commissions increased $399.9 million, or 110.6%, compared to 2007, primarily due to
$431.7 million in mark to market gains on our public debt and related hedges during 2008 compared with gains of $140.9
million in 2007. These gains were related to the widening of credit spreads across the entire financial market as a result of the
global credit crisis. When stability in the debt market returns, spreads are expected to tighten, and if this occurs then these
valuation gains will reverse. The increase in trading income during 2008 was also due to strong performance in fixed income
sales and trading, direct finance, and foreign exchange within our broker/dealer subsidiary offset by weaker performance in
fixed income derivatives, structured leasing, and equity offerings due to volatile market conditions. The gains recorded
during 2008 were partially offset by $255.9 million in mark to market losses on illiquid trading securities acquired during the
fourth quarter of 2007 as a result of the continuing declines in home values and increasing consumer real estate delinquency
levels, which affected liquidity and technical pricing in the broader market during the year related to ABS. Also offsetting
these gains were $177.7 million in losses related to our decision to purchase certain ARS from our clients, along with
associated fines, and a $63.8 million loss on a $70 million (par value) Lehman Brothers Holdings, Inc. (“Lehman Brothers”)
bond we purchased from an affiliated money market mutual fund. As of December 31, 2008, the fair value of this bond was
$6.7 million. See additional discussion of this security that was purchased in the “Trading Assets and Liabilities” section of
this MD&A. The fair value of the illiquid securities acquired in the fourth quarter of 2007 declined to approximately $250.0
million as of December 31, 2008, down from an acquisition cost of approximately $3.5 billion, primarily due to sales. During
2007, we recorded $527.7 million in negative mark to market valuations on collateralized debt obligations, MBS, SIV
securities, and collateralized loan obligations, which were partially offset by $81.0 million in gains related to the adoption of
fair value for certain trading assets and liabilities and related hedges.
During 2008, the $177.7 million loss in trading account profits and commissions related to ARS was recognized because we
determined that we had a probable loss pursuant to the provisions of SFAS No. 5 that could be reasonably estimated as the
difference between the par amount and the estimated fair value of ARS that we believe we will likely purchase from
investors. As of December 31, 2008, we have completed the repurchase of roughly one-third of the approximately $743
million face value of the securities. Approximately $643 million of these securities are either government sponsored or where
the issuer has indicated support of the underlying assets. The remaining $100 million of securities pertains to a senior tranche
within a securitization of trust preferred securities. Our cash flow projections under even a stressed scenario indicate full
collection of principal and interest on these securities. The volume of repurchase activity increased in early 2009, and
through mid-February, we have completed approximately three-fourths of the expected repurchases.
Combined mortgage-related income decreased $326.8 million, or 114.1%, compared to 2007. Mortgage servicing related
income decreased $407.2 million, or 208.4%, compared to 2007, primarily due to $370.0 million in impairment charges on
our MSRs portfolio, all carried at amortized cost, that was caused by an increase in expected loan prepayments due to
declining interest rates during the fourth quarter of 2008. The decrease in 2008 was also driven by higher amortization of
MSRs driven by growth in the servicing portfolio from $114.6 billion as of December 31, 2007 to $130.5 billion as of
December 31, 2008, and lower gains on the sale of mortgage servicing assets when compared to 2007. These declines were
offset by higher servicing fee income driven by the aforementioned growth in the servicing portfolio.
Mortgage production related income increased $80.4 million, or 88.4%, compared to 2007, despite a 37.6% decline in loan
production volume to $36.4 billion in 2008, due to lower valuation losses resulting from spread widening on loans held for
25