SunTrust 2008 Annual Report Download - page 10
Download and view the complete annual report
Please find page 10 of the 2008 SunTrust annual report below. You can navigate through the pages in the report by either clicking on the pages listed below, or by using the keyword search tool below to find specific information within the annual report.-
 1
1 -
 2
2 -
 3
3 -
 4
4 -
 5
5 -
 6
6 -
 7
7 -
 8
8 -
 9
9 -
 10
10 -
 11
11 -
 12
12 -
 13
13 -
 14
14 -
 15
15 -
 16
16 -
 17
17 -
 18
18 -
 19
19 -
 20
20 -
 21
21 -
22
-
23
-
24
-
25
-
26
-
27
-
28
-
29
-
30
-
31
-
32
-
33
-
34
-
35
-
36
-
37
-
38
-
39
-
40
-
41
-
42
-
43
-
44
-
45
-
46
-
47
-
48
-
49
-
50
-
51
-
52
-
53
-
54
-
55
-
56
-
57
-
58
-
59
-
60
-
61
-
62
-
63
-
64
-
65
-
66
-
67
-
68
-
69
-
70
-
71
-
72
-
73
-
74
-
75
-
76
-
77
-
78
-
79
-
80
-
81
-
82
-
83
-
84
-
85
-
86
-
87
-
88
-
89
-
90
-
91
-
92
-
93
-
94
-
95
-
96
-
97
-
98
-
99
-
100
-
101
-
102
-
103
-
104
-
105
-
106
-
107
-
108
-
109
-
110
-
111
-
112
-
113
-
114
-
115
-
116
-
117
-
118
-
119
-
120
-
121
-
122
-
123
-
124
-
125
-
126
-
127
-
128
-
129
-
130
-
131
-
132
-
133
-
134
-
135
-
136
-
137
-
138
-
139
-
140
-
141
-
142
-
143
-
144
-
145
-
146
-
147
-
148
-
149
-
150
-
151
-
152
-
153
-
154
-
155
-
156
-
157
-
158
-
159
-
160
-
161
-
162
-
163
-
164
-
165
-
166
-
167
-
168
-
169
-
170
-
171
-
172
-
173
-
174
-
175
-
176
-
177
-
178
-
179
-
180
-
181
-
182
-
183
-
184
-
185
-
186
-
187
-
188
 |
 |

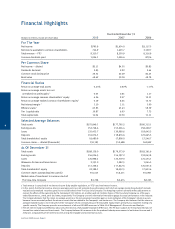
Year Ended December 31
(Dollars in millions, except per share data) 2008 2007 2006
For The Year
Net income $795.8 $1,634.0 $2,117.5
Net income available to common shareholders 746.9 1,603.7 2,109.7
Total revenue — FTE 1 9,210.7 8,250.9 8,216.8
Common dividends paid 1,004.1 1,026.6 879.6
Per Common Share
Net income — diluted $2.13 $4.55 $5.82
Dividends declared 2.85 2.92 2.44
Common stock closing price 29.54 62.49 84.45
Book value 48.42 50.38 48.78
Financial Ratios
Return on average total assets 0.45% 0.92% 1.17%
Return on average assets less net
unrealized securities gains 2 0.05 0.81 1.17
Return on average common shareholders’ equity 4.26 9.27 12.13
Return on average realized common shareholders’ equity 2 0.19 8.65 12.72
Net interest margin 3 3.10 3.11 3.00
Efficiency ratio 3 63.95 63.43 59.39
Tier 1 capital ratio 10.87 6.93 7.72
Total capital ratio 14.04 10.30 11.11
Selected Average Balances
Total assets $175,848.3 $177,795.5 $180,315.1
Earning assets 152,748.6 155,204.4 158,428.7
Loans 125,432.7 120,080.6 119,645.2
Deposits 116,076.3 119,876.6 123,665.5
Total shareholders’ equity 18,480.9 17,808.0 17,546.7
Common shares — diluted (thousands) 350,183 352,688 362,802
As Of December 31
Total assets $189,138.0 $179,573.9 $182,161.6
Earning assets 156,016.5 154,397.2 159,063.8
Loans 126,998.4 122,319.0 121,454.3
Allowance for loan and lease losses 2,351.0 1,282.5 1,044.5
Deposits 113,328.4 117,842.6 124,021.6
Total shareholders’ equity 22,388.1 18,052.5 17,813.6
Common shares outstanding (thousands) 354,515 348,411 354,903
Market value of investment in common stock of
The Coca-Cola Company $1,358 $2,674 $2,325
1 Total revenue is comprised of net interest income (fully taxable-equivalent, or “FTE”) and noninterest income.
2 In this report, SunTrust presents a return on average assets less net unrealized securities gains and return on average realized equity which exclude
realized and unrealized securities gains/losses and dividends from The Coca-Cola Company. The foregoing numbers primarily reflect adjustments to
remove the effects of the ownership by the Company of 30.0 million, 43.6 million and 48.2 million shares of The Coca-Cola Company, as of the years
ended December 31, 2008, 2007 and 2006, respectively. The Company uses this information internally to gauge its actual performance in the industry.
The Company believes that the return on average assets less the net unrealized securities gains is more indicative of the Company’s return on assets
because it more accurately reflects the return on assets that are related to the Company’s core businesses. The Company also believes that the return on
average realized equity is more indicative of the Company’s return on equity because the excluded equity relates primarily to a long-term holding of a
specific security. The Company provides reconcilements of all non-US GAAP measures in Table 22 of Management’s Discussion and Analysis.
3 The net interest margin and efficiency ratios are presented on a fully taxable-equivalent (FTE) basis. The FTE basis adjusts for the tax-favored status of
income from certain loans and investments. The Company believes this measure to be the preferred industry measurement of net interest income and it
enhances comparability of net interest income arising from taxable and tax-exempt sources.
SunTrust 2008 Annual Report
8
Financial Highlights