SunTrust 2008 Annual Report Download - page 33
Download and view the complete annual report
Please find page 33 of the 2008 SunTrust annual report below. You can navigate through the pages in the report by either clicking on the pages listed below, or by using the keyword search tool below to find specific information within the annual report.-
 1
1 -
2
-
3
-
4
-
5
-
6
-
7
-
8
-
9
-
10
-
11
-
12
-
13
-
14
-
15
-
16
-
17
-
18
-
19
-
20
-
21
-
22
-
 23
23 -
 24
24 -
 25
25 -
 26
26 -
 27
27 -
 28
28 -
 29
29 -
 30
30 -
 31
31 -
 32
32 -
 33
33 -
 34
34 -
 35
35 -
 36
36 -
 37
37 -
 38
38 -
 39
39 -
 40
40 -
 41
41 -
 42
42 -
 43
43 -
44
-
45
-
46
-
47
-
48
-
49
-
50
-
51
-
52
-
53
-
54
-
55
-
56
-
57
-
58
-
59
-
60
-
61
-
62
-
63
-
64
-
65
-
66
-
67
-
68
-
69
-
70
-
71
-
72
-
73
-
74
-
75
-
76
-
77
-
78
-
79
-
80
-
81
-
82
-
83
-
84
-
85
-
86
-
87
-
88
-
89
-
90
-
91
-
92
-
93
-
94
-
95
-
96
-
97
-
98
-
99
-
100
-
101
-
102
-
103
-
104
-
105
-
106
-
107
-
108
-
109
-
110
-
111
-
112
-
113
-
114
-
115
-
116
-
117
-
118
-
119
-
120
-
121
-
122
-
123
-
124
-
125
-
126
-
127
-
128
-
129
-
130
-
131
-
132
-
133
-
134
-
135
-
136
-
137
-
138
-
139
-
140
-
141
-
142
-
143
-
144
-
145
-
146
-
147
-
148
-
149
-
150
-
151
-
152
-
153
-
154
-
155
-
156
-
157
-
158
-
159
-
160
-
161
-
162
-
163
-
164
-
165
-
166
-
167
-
168
-
169
-
170
-
171
-
172
-
173
-
174
-
175
-
176
-
177
-
178
-
179
-
180
-
181
-
182
-
183
-
184
-
185
-
186
-
187
-
188
 |
 |
decline in the residential real estate markets and broader recessionary economic conditions. As such, we took steps to assure
continued prudent lending practices were followed by extending credit to clients that met our underwriting standards as well
as instituted certain loss mitigation steps. Furthering our already strong lending practices, in 2008, we evaluated our
underwriting standards based on the current economic conditions, discontinued originating home equity lines through third
party channels that tend to be riskier with higher loan-to-values at origination, and implemented revised loan-to-value
guidelines in certain declining markets. As a result of the tumultuous economy during 2008, we took action to assist in
mitigating potential losses that included reducing or closing high risk accounts, improving our on-going portfolio monitoring,
and completing extensive loan workout programs. Our workout programs are designed to help clients stay in their homes by
re-working residential mortgages and home equity loans to achieve payment structures that they could afford. Through this
workout program we have helped over 18,000 clients who were at risk of foreclosure to stay in their homes. See additional
discussion of our prudent lending initiatives and loss mitigation steps in the “Loans”, “Allowance for Loans and Lease
Losses”, “Provision for Loan Losses”, and “Nonperforming Assets” sections of this MD&A.
As the economy worsened and credit-related losses increased in 2008, our continued vigilance over expenses became an
important focus. Our Excellence in Execution Efficiency and Productivity Program (“E2Program”) began in 2007, well
before the recession, to lower our cost structure and drive higher financial performance. This successful program allowed us
to reduce expense run rates by $560 million in 2008 and is expected to provide total savings of $600 million in 2009. In
addition, we have taken additional extraordinary steps to manage expenses including the elimination of annual merit based
salary increases in 2009 for our senior management team, comprised of over 4,000 individuals, as well as paying no bonuses
to selected members of the executive management team. We have also lowered the expected average wage increase for those
receiving a merit increase by one-third, reduced the amount available for promotion increases, eliminated our annual sales
conference and sales award trips for our top producers, and have placed further restriction on travel and meal related
expenses.
The prevailing economic conditions and the resulting destabilization of many other financial institutions present an
opportunity for us to establish new customer relationships and expand existing ones by increasing our brand awareness. As a
result of these difficult economic times, we found that consumers are looking for a stable banking partner that mirrors their
values of being cautious and prudent with their finances, which is the source of our new branding “Live Solid. Bank Solid.”
Our focus is on providing that stability to our current and future clients with core business products. Our objectives include
increasing core business revenues while obtaining lower funding costs through growth in customer deposits. The “Live Solid.
Bank Solid.” brand compliments the “My Cause” deposit campaign, which ended in October 2008. During 2008, “My
Cause” generated total household deposit growth of approximately 8%, with checking account households growing
approximately 10%. Deposit growth continued during the fourth quarter of 2008, where we grew our average consumer and
commercial deposits by 2.0% over the third quarter of 2008. In 2009, we will continue our focus on growing customer
deposits.
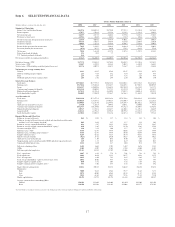
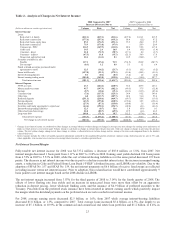
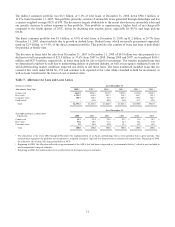
We reported net income available to common shareholders at December 31, 2008 of $746.9 million, or $2.13 per average
common diluted share, compared to $1.6 billion, or $4.55 per average common diluted share, at December 31, 2007. Fully
taxable-equivalent net interest income was $4.7 billion for the year ended December 31, 2008, compared to $4.8 billion for
the year ended December 31, 2007. Net interest margin in 2008 decreased only one basis point when compared to the prior
year. Provision for loan losses was $2.5 billion for the year ended 2008, an increase of $1.8 billion from the prior year. The
provision for loan losses was $909.9 million higher than net charge-offs of $1.6 billion for the year. The allowance for loan
and lease losses increased $1.1 billion, or 83.3%, from December 31, 2007 and was 1.86% of total loans not carried at fair
value compared to 1.05% as of December 31, 2007. Net charge-offs to average loans were 1.25% for the year ended 2008
compared to 0.35% for 2007. Nonperforming assets rose significantly during the year to $4.5 billion at year end compared to
$1.6 billion at the end of last year. The Tier 1 Capital and total capital ratios improved from 6.93% and 10.30%, respectively,
at December 31, 2007 to 10.87% and 14.04% at December 31, 2008. The tangible equity to tangible assets ratio improved
from 6.31% at December 31, 2007 to 8.40% at December 31, 2008, while the tangible common equity to tangible assets ratio
declined to 5.53% from 6.02% during this same time. See additional discussion of our financial performance in the
“Consolidated Financial Results” section of this MD&A.
21