SunTrust 2008 Annual Report Download - page 85
Download and view the complete annual report
Please find page 85 of the 2008 SunTrust annual report below. You can navigate through the pages in the report by either clicking on the pages listed below, or by using the keyword search tool below to find specific information within the annual report.-
 1
1 -
2
-
3
-
4
-
5
-
6
-
7
-
8
-
9
-
10
-
11
-
12
-
13
-
14
-
15
-
16
-
17
-
18
-
19
-
20
-
21
-
22
-
23
-
24
-
25
-
26
-
27
-
28
-
29
-
30
-
31
-
32
-
33
-
34
-
35
-
36
-
37
-
38
-
39
-
40
-
41
-
42
-
43
-
44
-
45
-
46
-
47
-
48
-
49
-
50
-
51
-
52
-
53
-
54
-
55
-
56
-
57
-
58
-
59
-
60
-
61
-
62
-
63
-
64
-
65
-
66
-
67
-
68
-
69
-
70
-
71
-
72
-
73
-
74
-
 75
75 -
 76
76 -
 77
77 -
 78
78 -
 79
79 -
 80
80 -
 81
81 -
 82
82 -
 83
83 -
 84
84 -
 85
85 -
 86
86 -
 87
87 -
 88
88 -
 89
89 -
 90
90 -
 91
91 -
 92
92 -
 93
93 -
 94
94 -
 95
95 -
96
-
97
-
98
-
99
-
100
-
101
-
102
-
103
-
104
-
105
-
106
-
107
-
108
-
109
-
110
-
111
-
112
-
113
-
114
-
115
-
116
-
117
-
118
-
119
-
120
-
121
-
122
-
123
-
124
-
125
-
126
-
127
-
128
-
129
-
130
-
131
-
132
-
133
-
134
-
135
-
136
-
137
-
138
-
139
-
140
-
141
-
142
-
143
-
144
-
145
-
146
-
147
-
148
-
149
-
150
-
151
-
152
-
153
-
154
-
155
-
156
-
157
-
158
-
159
-
160
-
161
-
162
-
163
-
164
-
165
-
166
-
167
-
168
-
169
-
170
-
171
-
172
-
173
-
174
-
175
-
176
-
177
-
178
-
179
-
180
-
181
-
182
-
183
-
184
-
185
-
186
-
187
-
188
 |
 |

Total noninterest expense increased $60.2 million, or 2.3%, from the same period in 2007. The continuing positive impact of
expense savings initiatives and lower amortization of intangibles was offset by higher credit-related expenses including
operating losses due to fraud, other real estate, and collections, as well as continued investments in the branch distribution
network.
Wholesale
Wholesale’s net income for the twelve months ended December 31, 2008 was $217.3 million, an increase of $21.2 million,
or 10.8%, compared to the same period in 2007. Lower market valuation trading losses in structured products and affordable
housing related noninterest expenses were partially offset by an increase in provision expense, lower merchant banking
gains, and higher incentive-based compensation.
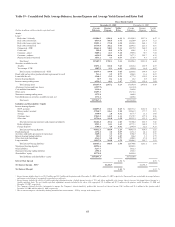
Net interest income was $564.7 million for the twelve months ended December 31, 2008, relatively unchanged from prior
year. Average loan balances increased $4.8 billion, or 16.2%, while the corresponding net interest income declined $7.1
million, or 1.6%. The migration of middle market clients from Retail and Commercial to Wholesale accounted for
approximately $1.8 billion of the increase in average loan balances and increased net interest income $25.8 million. The
remainder of Wholesale’s average loans increased $3.0 billion, or 10.4%, driven by increased corporate banking loans and
lease financing, which was partially offset by reductions in the residential builder portfolio. The corresponding net interest
income declined $32.9 million, or 7.3%, due to a shift in mix away from higher spread residential construction loans to lower
spread commercial loans, as well as an increase in residential construction nonaccrual loans. Total average deposits increased
$3.5 billion, or 63.2%, primarily in higher cost interest-bearing deposits. Deposit-related net interest income decreased $8.9
million, or 6.6%, driven by the lower credit for funds on demand deposits partially offset by the increased volumes in higher
cost deposit products.
Provision for loan losses was $167.4 million, an increase of $120.5 million over the prior year, resulting from higher
residential builder related charge-offs as well as increased charge-offs on middle market clients partially offset by lower
charge-offs in corporate banking.
Noninterest income increased $168.2 million, or 35.0%, primarily due to lower market valuation trading losses in structured
products. In addition, increases in direct finance, loan syndications, credit-related fees, and fixed income sales and trading
were partially offset by a reduction in merchant banking gains and lower revenues in structured leasing, derivatives, and
Affordable Housing.
Noninterest expense increased $6.4 million, or 0.8%, primarily due to the transfer of the middle market business from Retail
and Commercial to Wholesale which accounted for approximately $24.9 million of the increase. The remainder of
Wholesale’s noninterest expense decreased $18.4 million, or 2.3%, primarily due to a decrease in write-downs related to
Affordable Housing properties offset in part by higher incentive-based compensation.
Mortgage
Mortgage reported a net loss for the twelve months ended December 31, 2008 of $561.8 million, compared to $5.4 million in
net income in 2007, a decrease of $567.2 million, principally due to higher credit-related costs.
Net interest income declined $67.0 million, or 12.8%. Average loans increased $0.5 billion, or 1.7%, while the resulting net
interest income declined $78.7 million. Nonaccrual loans accounted for $46.0 million of the net interest income decline as
average nonaccrual loans increased $1.1 billion. Accruing loans declined $0.5 billion, or 1.8%, while net interest income
decreased $32.7 million, or 8.5%. The decline in net interest income was influenced by a change in product mix as declines
in construction-perm and Alt-A balances were replaced with lower yielding prime first lien mortgages. Average mortgage
loans held for sale declined $5.5 billion; however, due to widening spreads, net interest income increased $25.4 million.
Average investment securities were up $0.8 billion while net interest income increased $21.5 million primarily due to
improved spreads. Average deposits increased $0.1 billion, or 4.8%, although net interest income on deposits and other
liabilities decreased $17.7 million primarily due to lower short-term interest rates.
Provision for loan losses increased $410.1 million to $491.3 million due to higher residential mortgage and residential
construction net charge-offs.
Total noninterest income increased $70.2 million, or 19.2%, due to reduced net valuation losses, increased production fee
income, and securities gains in excess of MSRs impairment, partially offset by higher repurchase reserves and lower gains
from the sale of MSRs. Total production income increased $83.2 million, or 85.5%, driven by reduced valuation losses
associated with secondary market loans and the recognition of loan origination fees resulting from our election to record
73