SunTrust 2008 Annual Report Download - page 89
Download and view the complete annual report
Please find page 89 of the 2008 SunTrust annual report below. You can navigate through the pages in the report by either clicking on the pages listed below, or by using the keyword search tool below to find specific information within the annual report.-
 1
1 -
2
-
3
-
4
-
5
-
6
-
7
-
8
-
9
-
10
-
11
-
12
-
13
-
14
-
15
-
16
-
17
-
18
-
19
-
20
-
21
-
22
-
23
-
24
-
25
-
26
-
27
-
28
-
29
-
30
-
31
-
32
-
33
-
34
-
35
-
36
-
37
-
38
-
39
-
40
-
41
-
42
-
43
-
44
-
45
-
46
-
47
-
48
-
49
-
50
-
51
-
52
-
53
-
54
-
55
-
56
-
57
-
58
-
59
-
60
-
61
-
62
-
63
-
64
-
65
-
66
-
67
-
68
-
69
-
70
-
71
-
72
-
73
-
74
-
75
-
76
-
77
-
78
-
 79
79 -
 80
80 -
 81
81 -
 82
82 -
 83
83 -
 84
84 -
 85
85 -
 86
86 -
 87
87 -
 88
88 -
 89
89 -
 90
90 -
 91
91 -
 92
92 -
 93
93 -
 94
94 -
 95
95 -
 96
96 -
 97
97 -
 98
98 -
 99
99 -
100
-
101
-
102
-
103
-
104
-
105
-
106
-
107
-
108
-
109
-
110
-
111
-
112
-
113
-
114
-
115
-
116
-
117
-
118
-
119
-
120
-
121
-
122
-
123
-
124
-
125
-
126
-
127
-
128
-
129
-
130
-
131
-
132
-
133
-
134
-
135
-
136
-
137
-
138
-
139
-
140
-
141
-
142
-
143
-
144
-
145
-
146
-
147
-
148
-
149
-
150
-
151
-
152
-
153
-
154
-
155
-
156
-
157
-
158
-
159
-
160
-
161
-
162
-
163
-
164
-
165
-
166
-
167
-
168
-
169
-
170
-
171
-
172
-
173
-
174
-
175
-
176
-
177
-
178
-
179
-
180
-
181
-
182
-
183
-
184
-
185
-
186
-
187
-
188
 |
 |

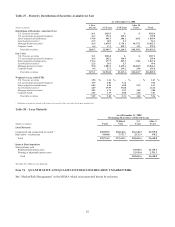
Provision for loan losses was $46.9 million, an improvement of $75.5 million, or 61.7%, from the same period of 2006 due to
the charge-off a single large commercial loan in the fourth quarter of 2006.
Total noninterest income decreased $286.1 million, or 37.3%, compared to 2006. The decrease was primarily driven by
write-downs and losses of approximately $316.1 million in collateralized debt obligations, MBS, and collateralized loan
obligation securities most of which occurred during the third and fourth quarters of 2007. Additional weakness in fixed
income trading, loan related fees, and M&A fee revenue was partially offset by strong performance in derivatives, structured
leasing, merchant banking and equipment lease financing.
Total noninterest expense increased $53.3 million, or 7.0%, compared to 2006. The increase was primarily driven by
increased write-downs related to Affordable Housing properties as well as higher outside processing, legal and consulting
expenses offset in part by lower personnel expense related to lower incentive-based compensation expense tied to revenue,
and lower shared corporate expenses.
Mortgage
Mortgage’s net income for the twelve months ended December 31, 2007 was $5.4 million, a decrease of $237.4 million, or
97.8%. The decline resulted primarily from $165.4 million in net valuation losses on mortgage loans held for sale due to
market volatility and mortgage spread widening in conjunction with increased credit-related losses on mortgage loans. These
losses were partially offset by higher mortgage servicing revenue.
Net interest income in 2007 declined $75.2 million, or 12.6%, compared to 2006 principally due to lower income from
portfolio loans and loans held for sale, as well as higher funding costs for MSRs, which was partially offset by higher net
interest income on deposits and investments. Average portfolio loans, principally consumer mortgages and residential
construction loans, declined $0.4 billion, or 1.4%. The volume decline combined with compressed spreads resulted in a
reduction of net interest income from total loans of $53.1 million. Average loans held for sale increased $0.5 billion;
however, compressed spreads more than offset the benefit of higher balances and reduced net interest income by $38.0
million. Funding costs on higher MSRs balances further reduced net interest income by $16.5 million. Net interest income
from deposits increased $17.8 million, while net interest income from investments increased $13.1 million.
Provision for loan losses for the year 2007 increased $72.4 million driven by higher consumer mortgage and residential
construction net charge-offs.
Total noninterest income declined $13.7 million, or 3.6%, due to lower production income, partially offset by higher
servicing and insurance income. Production income declined $103.9 million on loans due to net valuation losses of $165.4
million on loans held for sale, primarily due to market volatility and mortgage spread widening. These declines were partially
offset by the recognition of origination fees that were deferred prior to the May 2007 fair value election for certain loans.
Loan production of $58.3 billion was up $3.0 billion, or 5.4%, for the year 2007. At December 31, 2007, total loans serviced
were $149.9 billion, an increase of $19.9 billion, or 15.3%. Revenues from mortgage insurance increased $10.0 million due
to new mortgage origination volume.
Total noninterest expense increased $222.3 million for the year 2007, or 36.9%, over 2006, principally due to increased
operating losses of $84.3 million driven by fraud from customer misrepresentations on loan related documents, primarily on
Alt-A products originated in prior periods, recognition of loan origination costs that were deferred prior to the May 2007
election to record certain loans at fair value, and increased credit and growth-related expenses.
Wealth and Investment Management
Wealth and Investment Management’s net income for the year ended December 31, 2007, was $88.3 million, a decrease of
$202.5 million, or 69.6%, compared to the year ended December 31, 2006. The decline was principally driven by a $250.5
million pre-tax mark to market loss on SIV securities and a $112.8 million pre-tax gain realized in 2006 on the sale of the
Bond Trustee business, partially offset by a $32.3 million pre-tax gain on sale upon merger of Lighthouse Partners into
Lighthouse Investment Partners and increased retail investment income in 2007.
For 2007, net interest income decreased $21.1 million, or 5.7%, as the continued shift in deposit mix to higher cost products
compressed spreads. Average deposits increased $303.3 million, or 3.2%, as increases in higher-cost NOW account and time
deposits were partially offset by declines in lower-cost demand deposit and money market account balances. This shift in
deposit mix coupled with a decline in spreads driven by deposit competition was the primary driver of a $16.2 million
decline in net interest income on deposits. Average loans declined $170.0 million, or 2.1%, resulting in a $5.3 million decline
in net interest income on loans. The decline in loan balances resulted from lower consumer and commercial loans.
77