SunTrust 2008 Annual Report Download - page 141
Download and view the complete annual report
Please find page 141 of the 2008 SunTrust annual report below. You can navigate through the pages in the report by either clicking on the pages listed below, or by using the keyword search tool below to find specific information within the annual report.-
 1
1 -
2
-
3
-
4
-
5
-
6
-
7
-
8
-
9
-
10
-
11
-
12
-
13
-
14
-
15
-
16
-
17
-
18
-
19
-
20
-
21
-
22
-
23
-
24
-
25
-
26
-
27
-
28
-
29
-
30
-
31
-
32
-
33
-
34
-
35
-
36
-
37
-
38
-
39
-
40
-
41
-
42
-
43
-
44
-
45
-
46
-
47
-
48
-
49
-
50
-
51
-
52
-
53
-
54
-
55
-
56
-
57
-
58
-
59
-
60
-
61
-
62
-
63
-
64
-
65
-
66
-
67
-
68
-
69
-
70
-
71
-
72
-
73
-
74
-
75
-
76
-
77
-
78
-
79
-
80
-
81
-
82
-
83
-
84
-
85
-
86
-
87
-
88
-
89
-
90
-
91
-
92
-
93
-
94
-
95
-
96
-
97
-
98
-
99
-
100
-
101
-
102
-
103
-
104
-
105
-
106
-
107
-
108
-
109
-
110
-
111
-
112
-
113
-
114
-
115
-
116
-
117
-
118
-
119
-
120
-
121
-
122
-
123
-
124
-
125
-
126
-
127
-
128
-
129
-
130
-
 131
131 -
 132
132 -
 133
133 -
 134
134 -
 135
135 -
 136
136 -
 137
137 -
 138
138 -
 139
139 -
 140
140 -
 141
141 -
 142
142 -
 143
143 -
 144
144 -
 145
145 -
 146
146 -
 147
147 -
 148
148 -
 149
149 -
 150
150 -
 151
151 -
152
-
153
-
154
-
155
-
156
-
157
-
158
-
159
-
160
-
161
-
162
-
163
-
164
-
165
-
166
-
167
-
168
-
169
-
170
-
171
-
172
-
173
-
174
-
175
-
176
-
177
-
178
-
179
-
180
-
181
-
182
-
183
-
184
-
185
-
186
-
187
-
188
 |
 |

SUNTRUST BANKS, INC.
Notes to Consolidated Financial Statements (Continued)
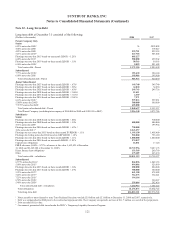
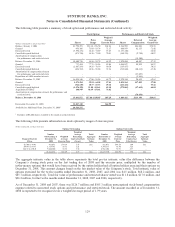
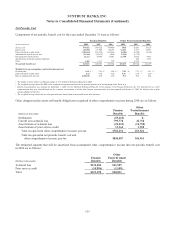
The following table presents a summary of stock option and performance and restricted stock activity:
Stock Options Performance and Restricted Stock
(Dollars in thousands except per share data) Shares
Price
Range
Weighted
Average
Exercise Price Shares
Deferred
Compensation
Weighted
Average
Grant Price
Balance, January 1, 2006 21,790,455 $14.18 -$76.50 $62.46 2,326,969 $26,222 $34.58
Granted 956,106 71.03 - 83.74 71.17 860,959 62,355 72.42
Exercised/vested (3,594,131) 14.18 - 74.89 53.63 (1,157,148) - 22.68
Cancelled/expired/forfeited (471,720) 14.18 - 73.40 70.81 (160,176) (9,750) 60.87
Amortization of compensation
for performance and restricted stock - - - - (18,340) -
Balance, December 31, 2006 18,680,710 14.56 - 83.74 64.39 1,870,604 60,487 57.12
Granted 717,494 77.75 - 85.06 85.04 1,054,837 88,892 84.27
Exercised/vested (2,887,293) 14.56 - 78.39 60.50 (339,437) - 50.21
Cancelled/expired/forfeited (452,765) 14.56 - 85.06 72.36 (315,660) (20,612) 65.30
Amortization of compensation element
for performance and restricted stock - - - - (35,299) -
Repurchase of AMA member interests - - - - (2,846) -
Balance, December 31, 2007 16,058,146 17.06 - 85.06 65.79 2,270,344 90,622 69.63
Granted 1,473,284 29.54 - 64.58 57.43 2,021,564 117,039 57.90
Exercised/vested (514,149) 18.77 - 65.33 49.16 (213,431) - 55.16
Cancelled/expired/forfeited (1,476,358) 31.80 -154.61 69.30 (275,065) (17,611) 64.04
Acquisition of GB&T 100,949 46.39 -154.61 76.82 - - -
Amortization of compensation element for performance and
restricted stock - - - - (76,656) -
Balance, December 31, 2008 15,641,872 $17.06 -$150.45 $65.29 3,803,412 $113,394 $64.61
Exercisable, December 31, 2008 12,827,330 $64.90
Available for Additional Grant, December 31, 2008 110,914,555
1Includes 4,108,204 shares available to be issued as restricted stock.
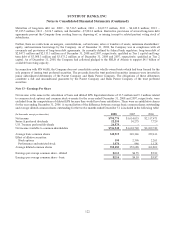
The following table presents information on stock options by ranges of exercise price:
(Dollars in thousands, except per share data)
Options Outstanding Options Exercisable
Range of Exercise
Prices
Number
Outstanding at
December 31,
2008
Weighted
Average
Exercise Price
Weighted
Average
Remaining
Contractual Life
(Years)
Total
Aggregate
Intrinsic
Value
Number
Exercisable at
December 31,
2008
Weighted
Average
Exercise
Price
Weighted
Average
Remaining
Contractual
Life (Years)
Total
Aggregate
Intrinsic
Value
$17.06 to 49.46 861,071 $39.34 5.47 $61 561,071 $44.58 3.04 $61
$49.47 to 64.57 5,314,741 56.51 3.25 - 5,304,157 56.50 3.25 -
$64.58 to 150.45 9,466,060 72.58 5.56 - 6,962,102 72.93 4.57 -
15,641,872 $65.29 4.77 $61 12,827,330 $64.90 3.96 $61
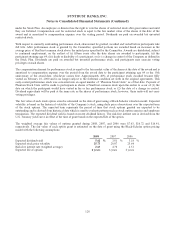
The aggregate intrinsic value in the table above represents the total pre-tax intrinsic value (the difference between the
Company’s closing stock price on the last trading day of 2008 and the exercise price, multiplied by the number of
in-the-money options) that would have been received by the option holders had all option holders exercised their options on
December 31, 2008. This amount changes based on the fair market value of the Company’s stock. Total intrinsic value of
options exercised for the twelve months ended December 31, 2008, 2007, and 2006 was $4.5 million, $68.2 million, and
$85.7 million, respectively. Total fair value of performance and restricted shares vested was $11.8 million, $17.0 million, and
$26.2 million, for the twelve months ended December 31, 2008, 2007 and 2006, respectively.
As of December 31, 2008 and 2007, there was $126.7 million and $105.3 million unrecognized stock-based compensation
expense related to nonvested stock options and performance and restricted stock. The amount recorded as of December 31,
2008 is expected to be recognized over a weighted average period of 1.79 years.
129