SunTrust 2008 Annual Report Download - page 167
Download and view the complete annual report
Please find page 167 of the 2008 SunTrust annual report below. You can navigate through the pages in the report by either clicking on the pages listed below, or by using the keyword search tool below to find specific information within the annual report.-
 1
1 -
2
-
3
-
4
-
5
-
6
-
7
-
8
-
9
-
10
-
11
-
12
-
13
-
14
-
15
-
16
-
17
-
18
-
19
-
20
-
21
-
22
-
23
-
24
-
25
-
26
-
27
-
28
-
29
-
30
-
31
-
32
-
33
-
34
-
35
-
36
-
37
-
38
-
39
-
40
-
41
-
42
-
43
-
44
-
45
-
46
-
47
-
48
-
49
-
50
-
51
-
52
-
53
-
54
-
55
-
56
-
57
-
58
-
59
-
60
-
61
-
62
-
63
-
64
-
65
-
66
-
67
-
68
-
69
-
70
-
71
-
72
-
73
-
74
-
75
-
76
-
77
-
78
-
79
-
80
-
81
-
82
-
83
-
84
-
85
-
86
-
87
-
88
-
89
-
90
-
91
-
92
-
93
-
94
-
95
-
96
-
97
-
98
-
99
-
100
-
101
-
102
-
103
-
104
-
105
-
106
-
107
-
108
-
109
-
110
-
111
-
112
-
113
-
114
-
115
-
116
-
117
-
118
-
119
-
120
-
121
-
122
-
123
-
124
-
125
-
126
-
127
-
128
-
129
-
130
-
131
-
132
-
133
-
134
-
135
-
136
-
137
-
138
-
139
-
140
-
141
-
142
-
143
-
144
-
145
-
146
-
147
-
148
-
149
-
150
-
151
-
152
-
153
-
154
-
155
-
156
-
 157
157 -
 158
158 -
 159
159 -
 160
160 -
 161
161 -
 162
162 -
 163
163 -
 164
164 -
 165
165 -
 166
166 -
 167
167 -
 168
168 -
 169
169 -
 170
170 -
 171
171 -
 172
172 -
 173
173 -
 174
174 -
 175
175 -
 176
176 -
 177
177 -
178
-
179
-
180
-
181
-
182
-
183
-
184
-
185
-
186
-
187
-
188
 |
 |

SUNTRUST BANKS, INC.
Notes to Consolidated Financial Statements (Continued)
(Dollars in thousands)
Aggregate
Fair Value
December 31, 2007
Aggregate
Unpaid Principal
Balance under FVO
December 31, 2007
Fair value
over/(under)
unpaid principal
Trading assets $444,774 $442,624 $2,150
Loans 220,784 229,473 (8,689)
Loans held for sale 6,314,106 6,248,541 65,565
Past due loans of 90 days or more 5,213 6,140 (927)
Nonaccrual loans 5,841 7,316 (1,475)
Brokered deposits 234,345 237,205 (2,860)
Long-term debt 7,446,980 7,316,750 130,230
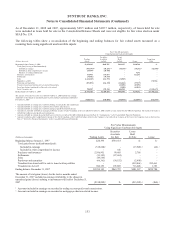
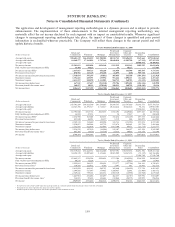
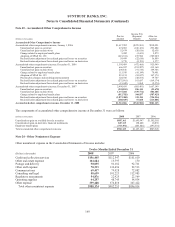
Fair Value of Financial Instruments
The carrying amounts and fair values of the Company’s financial instruments at December 31 were as follows:
2008 2007
(Dollars in thousands)
Carrying
Amount
Fair
Value
Carrying
Amount
Fair
Value
Financial assets
Cash and cash equivalents $6,637,402 $6,637,402 (a) $5,642,601 $5,642,601 (a)
Trading assets 10,396,269 10,396,269 (b) 10,518,379 10,518,379 (b)
Securities available for sale 19,696,537 19,696,537 (b) 16,264,107 16,264,107 (b)
Loans held for sale 4,032,128 4,032,128 (c) 8,851,695 8,853,694 (c)
Total loans 126,998,443 126,998,443 122,318,994 122,318,994
Interest/credit adjustment (2,350,996) (4,369,121) (1,282,504) (1,050,039)
Subtotal 124,647,447 122,629,322 (d) 121,036,490 121,268,955 (d)
Market risk/liquidity adjustment - (11,731,290) --
Loans, net $124,647,447 $110,898,032 (d) $121,036,490 $121,268,955 (d)
Financial liabilities
Consumer and commercial deposits $105,275,707 $105,770,657 (e) $101,870,025 $101,889,709 (e)
Brokered deposits 7,667,167 7,586,427 (f) 11,715,024 11,693,673 (f)
Foreign deposits 385,510 385,510 (f) 4,257,601 4,257,738 (f)
Short-term borrowings 9,479,750 9,479,750 (f) 12,200,820 12,200,820 (f)
Long-term debt 26,812,381 25,878,644 (f) 22,956,508 22,733,420 (f)
Trading liabilities 3,240,784 3,240,784 (b) 2,160,385 2,160,385 (b)
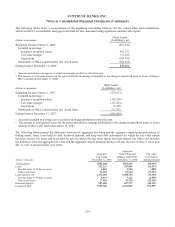
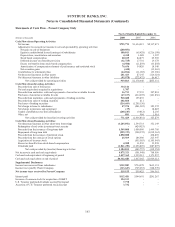
The following methods and assumptions were used by the Company in estimating the fair value of financial instruments. See
“Level 3 Instruments” in this footnote for a more detailed discussion of the methods and assumptions used to value the
Company’s Level 3 instruments:
(a) Cash and cash equivalents are valued at their carrying amounts reported in the balance sheet, which are reasonable
estimates of fair value due to the relatively short period to maturity of the instruments.
(b) Securities available for sale, trading assets and trading liabilities are valued based on quoted market prices or, if
quoted market prices are not available, on quoted market prices of comparable instruments. In instances when
significant valuation assumptions are not readily observable in the market, instruments are valued based on the best
available data in order to approximate fair value. This data may be internally-developed and considers risk
premiums that a market participant would require.
(c) Loans held for sale are valued based on observable current market prices or, if quoted market prices are not
available, on quoted market prices of comparable instruments. In instances when significant valuation assumptions
are not readily observable in the market, instruments are valued based on the best available data in order to
approximate fair value. This data may be internally-developed and considers risk premiums that a market
participant would require.
(d) Loan fair values are based on a hypothetical exit price, which does not represent the estimated intrinsic value of the
loan if held for investment. The assumptions used are expected to approximate those that a market participant
purchasing the loans would use to value the loans, including a market risk premium and liquidity discount.
155