SunTrust 2008 Annual Report Download - page 115
Download and view the complete annual report
Please find page 115 of the 2008 SunTrust annual report below. You can navigate through the pages in the report by either clicking on the pages listed below, or by using the keyword search tool below to find specific information within the annual report.-
 1
1 -
2
-
3
-
4
-
5
-
6
-
7
-
8
-
9
-
10
-
11
-
12
-
13
-
14
-
15
-
16
-
17
-
18
-
19
-
20
-
21
-
22
-
23
-
24
-
25
-
26
-
27
-
28
-
29
-
30
-
31
-
32
-
33
-
34
-
35
-
36
-
37
-
38
-
39
-
40
-
41
-
42
-
43
-
44
-
45
-
46
-
47
-
48
-
49
-
50
-
51
-
52
-
53
-
54
-
55
-
56
-
57
-
58
-
59
-
60
-
61
-
62
-
63
-
64
-
65
-
66
-
67
-
68
-
69
-
70
-
71
-
72
-
73
-
74
-
75
-
76
-
77
-
78
-
79
-
80
-
81
-
82
-
83
-
84
-
85
-
86
-
87
-
88
-
89
-
90
-
91
-
92
-
93
-
94
-
95
-
96
-
97
-
98
-
99
-
100
-
101
-
102
-
103
-
104
-
 105
105 -
 106
106 -
 107
107 -
 108
108 -
 109
109 -
 110
110 -
 111
111 -
 112
112 -
 113
113 -
 114
114 -
 115
115 -
 116
116 -
 117
117 -
 118
118 -
 119
119 -
 120
120 -
 121
121 -
 122
122 -
 123
123 -
 124
124 -
 125
125 -
126
-
127
-
128
-
129
-
130
-
131
-
132
-
133
-
134
-
135
-
136
-
137
-
138
-
139
-
140
-
141
-
142
-
143
-
144
-
145
-
146
-
147
-
148
-
149
-
150
-
151
-
152
-
153
-
154
-
155
-
156
-
157
-
158
-
159
-
160
-
161
-
162
-
163
-
164
-
165
-
166
-
167
-
168
-
169
-
170
-
171
-
172
-
173
-
174
-
175
-
176
-
177
-
178
-
179
-
180
-
181
-
182
-
183
-
184
-
185
-
186
-
187
-
188
 |
 |

SUNTRUST BANKS, INC.
Notes to Consolidated Financial Statements (Continued)
reviewed them for other-than-temporary impairment in accordance with the accounting policies outlined in Note 1,
“Significant Accounting Policies,” to the Consolidated Financial Statements and does not consider them to be other-than-
temporarily impaired. As of December 31, 2008, approximately 94% of the total securities available for sale portfolio are
rated “AAA,” the highest possible rating by nationally recognized rating agencies.
Management evaluates securities for other-than-temporary impairment on a quarterly basis, and more frequently when
conditions warrant such evaluation. Factors considered in determining whether an impairment is other-than-temporary include
(1) the length of time and the extent to which the fair value has been less than cost, (2) the financial condition and near-term
prospects of the underlying collateral, including expected default and loss severity estimates, and (3) the intent and ability of the
Company to hold the investment for a period of time sufficient to allow for any anticipated recovery in fair value.
During 2008, the Company recorded $83.8 million in other-than-temporary impairment within securities gains/(losses),
primarily related to $269.4 million in residential MBS and residual interests in mortgage securitizations in which the default
rates and loss severities of the underlying collateral, including subprime and Alt-A loans, increased significantly during the
year. Impairment was recorded on securities for which there had been an adverse change in estimated cash flows for
purposes of determining fair value. These securities were valued using either third party pricing data, including broker
indicative bids, or expected cash flow models. There were no similar charges recorded in 2007.
The Company holds stock in the FHLB of Atlanta and FHLB of Cincinnati totaling $493.2 million as of December 31, 2008.
The Company accounts for the stock based on the industry guidance in SOP 01-6 “Accounting by Certain Entities (Including
Entities With Trade Receivables) That Lend to or Finance the Activities of Others”, which requires the investment be carried
at cost and be evaluated for impairment based on the ultimate recoverability of the par value. The Company evaluated its
holdings in FHLB stock at December 31, 2008 and believes its holdings in the stock are ultimately recoverable at par. In
addition, the Company does not have operational or liquidity needs that would require a redemption of the stock in the
foreseeable future and therefore determined that the stock was not other-than-temporarily impaired. In February 2009, the
Company repaid all of the FHLB advances outstanding and closed out its exposures on the interest rate swaps.
Approximately $150.3 million of FHLB stock was redeemed in conjunction with the repayment of the advances.
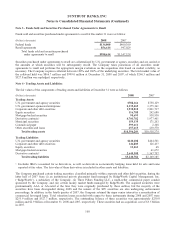
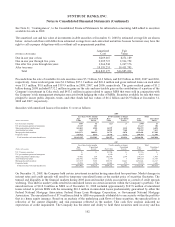
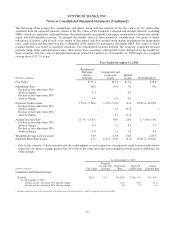
Note 6 - Loans
The composition of the Company’s loan portfolio at December 31 is shown in the following table:
(Dollars in millions) 2008 2007
Commercial $41,039.9 $35,929.4
Real estate:
Home equity lines 16,454.4 14,911.6
Construction 9,864.0 13,776.7
Residential mortgages 32,065.8 32,779.7
Commercial real estate 14,957.1 12,609.5
Consumer:
Direct 5,139.3 3,963.9
Indirect 6,507.6 7,494.1
Credit card 970.3 854.1
Total loans $126,998.4 $122,319.0
All nonaccrual loans at December 31, 2008 and December 31, 2007 were considered impaired. Total nonaccrual loans at
December 31, 2008 and 2007 were $3,940.0 million and $1,430.4 million, respectively. The gross amounts of interest income
that would have been recorded in 2008, 2007, and 2006 on nonaccrual loans at December 31 of each year, if all such loans
had been accruing interest at their contractual rates, were $233.3 million, $85.0 million, and $41.6 million, respectively. At
December 31, 2008, and 2007, accruing loans past due 90 days or more were $1,032.3 million and $611.0 million,
respectively, and increased primarily related to loans sold to Government National Mortgage Association that we have
repurchased or have the right to repurchase which are guaranteed by U.S. government agencies.
Loans individually evaluated in accordance with SFAS No. 114 and restructured loans (accruing and nonaccruing) at
December 31, 2008, and 2007 were $1,595.8 million and $177.5 million, respectively, and the related allowance for loan and
lease losses was $201.8 million and $17.5 million, respectively. At December 31, 2008 and 2007, certain impaired loans
requiring an allowance for loan losses were $1,522.3 million and $145.2 million, respectively.
103