SunTrust 2008 Annual Report Download - page 94
Download and view the complete annual report
Please find page 94 of the 2008 SunTrust annual report below. You can navigate through the pages in the report by either clicking on the pages listed below, or by using the keyword search tool below to find specific information within the annual report.-
 1
1 -
2
-
3
-
4
-
5
-
6
-
7
-
8
-
9
-
10
-
11
-
12
-
13
-
14
-
15
-
16
-
17
-
18
-
19
-
20
-
21
-
22
-
23
-
24
-
25
-
26
-
27
-
28
-
29
-
30
-
31
-
32
-
33
-
34
-
35
-
36
-
37
-
38
-
39
-
40
-
41
-
42
-
43
-
44
-
45
-
46
-
47
-
48
-
49
-
50
-
51
-
52
-
53
-
54
-
55
-
56
-
57
-
58
-
59
-
60
-
61
-
62
-
63
-
64
-
65
-
66
-
67
-
68
-
69
-
70
-
71
-
72
-
73
-
74
-
75
-
76
-
77
-
78
-
79
-
80
-
81
-
82
-
83
-
 84
84 -
 85
85 -
 86
86 -
 87
87 -
 88
88 -
 89
89 -
 90
90 -
 91
91 -
 92
92 -
 93
93 -
 94
94 -
 95
95 -
 96
96 -
 97
97 -
 98
98 -
 99
99 -
 100
100 -
 101
101 -
 102
102 -
 103
103 -
 104
104 -
105
-
106
-
107
-
108
-
109
-
110
-
111
-
112
-
113
-
114
-
115
-
116
-
117
-
118
-
119
-
120
-
121
-
122
-
123
-
124
-
125
-
126
-
127
-
128
-
129
-
130
-
131
-
132
-
133
-
134
-
135
-
136
-
137
-
138
-
139
-
140
-
141
-
142
-
143
-
144
-
145
-
146
-
147
-
148
-
149
-
150
-
151
-
152
-
153
-
154
-
155
-
156
-
157
-
158
-
159
-
160
-
161
-
162
-
163
-
164
-
165
-
166
-
167
-
168
-
169
-
170
-
171
-
172
-
173
-
174
-
175
-
176
-
177
-
178
-
179
-
180
-
181
-
182
-
183
-
184
-
185
-
186
-
187
-
188
 |
 |

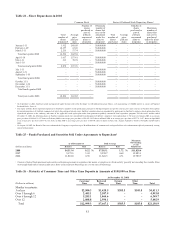
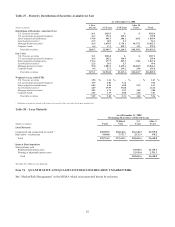
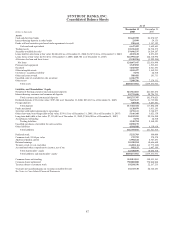
Table 27 – Maturity Distribution of Securities Available for Sale
As of December 31, 2008
(Dollars in millions)
1 Year
or Less 1-5 Years 5-10 Years
After 10
Years Total
Distribution of Maturities: Amortized Cost
U.S. Treasury securities $1.1 $124.5 $- $- $125.6
U.S. government-sponsored enterprises 16.3 193.4 129.3 - 339.0
States and political subdivisions 174.0 461.5 200.3 183.1 1,018.9
Asset-backed securities121.5 30.5 2.1 - 54.1
Mortgage-backed securities156.4 2,078.5 2,710.1 10,177.1 15,022.1
Corporate bonds 0.4 17.3 222.7 35.1 275.5
Total debt securities $269.7 $2,905.7 $3,264.5 $10,395.3 $16,835.2
Fair Value
U.S. Treasury securities $1.1 $126.0 $- $- $127.1
U.S. government-sponsored enterprises 16.4 202.2 140.4 - 359.0
States and political subdivisions 175.6 477.7 205.9 178.2 1,037.4
Asset-backed securities122.6 24.5 2.5 - 49.6
Mortgage-backed securities155.0 2,087.2 2,699.6 10,204.5 15,046.3
Corporate bonds 0.4 17.2 219.2 29.0 265.8
Total debt securities $271.1 $2,934.8 $3,267.6 $10,411.7 $16,885.2
Weighted average yield (FTE):
U.S. Treasury securities 1.98 % 1.46 % - % - % 1.47 %
U.S. government-sponsored enterprises 4.79 4.06 5.16 - 4.52
States and political subdivisions 6.05 6.24 6.00 5.93 6.11
Asset-backed securities12.69 39.99 19.60 - 24.36
Mortgage-backed securities14.92 5.74 5.22 4.84 5.04
Corporate bonds 2.46 5.39 6.00 2.85 5.83
Total debt securities 5.45 % 5.88 % 5.33 % 4.86 % 5.14 %
1Distribution of maturities is based on the expected average life of the asset and is based upon amortized cost.
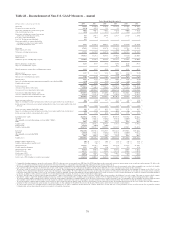
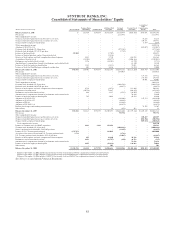
Table 28 – Loan Maturity
As of December 31, 2008
Remaining Maturities of Selected Loans
(Dollars in millions) Total
Within 1
Year
1-5
Years
After 5
Years
Loan Maturity
Commercial and commercial real estate 1$49,870.9 $20,242.6 $26,348.5 $3,279.8
Real estate—construction 9,864.0 7,372.7 2,121.1 370.2
Total $59,734.9 $27,615.3 $28,469.6 $3,650.0
Interest Rate Sensitivity
Selected loans with:
Predetermined interest rates $5,928.6 $1,138.5
Floating or adjustable interest rates 22,541.0 2,511.5
Total $28,469.6 $3,650.0
1Excludes $6.1 billion in lease financing.
Item 7A. QUANTITATIVE AND QUALITATIVE DISCLOSURES ABOUT MARKET RISK
See “Market Risk Management” in the MD&A which is incorporated herein by reference.
82