SunTrust 2008 Annual Report Download - page 65
Download and view the complete annual report
Please find page 65 of the 2008 SunTrust annual report below. You can navigate through the pages in the report by either clicking on the pages listed below, or by using the keyword search tool below to find specific information within the annual report.-
 1
1 -
2
-
3
-
4
-
5
-
6
-
7
-
8
-
9
-
10
-
11
-
12
-
13
-
14
-
15
-
16
-
17
-
18
-
19
-
20
-
21
-
22
-
23
-
24
-
25
-
26
-
27
-
28
-
29
-
30
-
31
-
32
-
33
-
34
-
35
-
36
-
37
-
38
-
39
-
40
-
41
-
42
-
43
-
44
-
45
-
46
-
47
-
48
-
49
-
50
-
51
-
52
-
53
-
54
-
 55
55 -
 56
56 -
 57
57 -
 58
58 -
 59
59 -
 60
60 -
 61
61 -
 62
62 -
 63
63 -
 64
64 -
 65
65 -
 66
66 -
 67
67 -
 68
68 -
 69
69 -
 70
70 -
 71
71 -
 72
72 -
 73
73 -
 74
74 -
 75
75 -
76
-
77
-
78
-
79
-
80
-
81
-
82
-
83
-
84
-
85
-
86
-
87
-
88
-
89
-
90
-
91
-
92
-
93
-
94
-
95
-
96
-
97
-
98
-
99
-
100
-
101
-
102
-
103
-
104
-
105
-
106
-
107
-
108
-
109
-
110
-
111
-
112
-
113
-
114
-
115
-
116
-
117
-
118
-
119
-
120
-
121
-
122
-
123
-
124
-
125
-
126
-
127
-
128
-
129
-
130
-
131
-
132
-
133
-
134
-
135
-
136
-
137
-
138
-
139
-
140
-
141
-
142
-
143
-
144
-
145
-
146
-
147
-
148
-
149
-
150
-
151
-
152
-
153
-
154
-
155
-
156
-
157
-
158
-
159
-
160
-
161
-
162
-
163
-
164
-
165
-
166
-
167
-
168
-
169
-
170
-
171
-
172
-
173
-
174
-
175
-
176
-
177
-
178
-
179
-
180
-
181
-
182
-
183
-
184
-
185
-
186
-
187
-
188
 |
 |

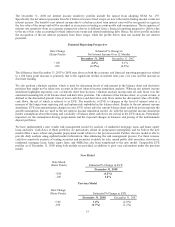
The December 31, 2008 net interest income sensitivity profiles include the impact from adopting SFAS No. 159.
Specifically, the net interest payments from $6.6 billion of receive fixed swaps are now reflected in trading income versus net
interest income. The benefit to net interest income due to a decline in short term interest rates will be recognized as a gain in
the fair value of the swaps and will be recorded as an increase in trading account profits and commissions. The recognition of
interest rate sensitivity from an economic perspective (above) is different from a financial reporting perspective (below) due
to the use of fair value accounting for these interest rate swaps and related underlying debt. Hence, the above profile includes
the recognition of the net interest payments from these swaps, while the profile below does not include the net interest
payments.
Financial Reporting Perspective
Rate Change
(Basis Points)
Estimated % Change in
Net Interest Income Over 12 Months
December 31, 2008 December 31, 2007
+100 4.2% 0.1%
-100 (1.3%) (0.8%)
The difference from December 31, 2007 to 2008 seen above in both the economic and financial reporting perspectives related
to a 100 basis point increase is primarily due to the significant decline in interest rates year over year and the increase in
fixed rate funding.
We also perform valuation analysis, which is used for discerning levels of risk present in the balance sheet and derivative
positions that might not be taken into account in the net interest income simulation analysis. Whereas net interest income
simulation highlights exposures over a relatively short time horizon, valuation analysis incorporates all cash flows over the
estimated remaining life of all balance sheet and derivative positions. The valuation of the balance sheet, at a point in time, is
defined as the discounted present value of asset cash flows and derivative cash flows minus the discounted value of liability
cash flows, the net of which is referred to as EVE. The sensitivity of EVE to changes in the level of interest rates is a
measure of the longer-term repricing risk and options risk embedded in the balance sheet. Similar to the net interest income
simulation, EVE uses instantaneous changes in rates. EVE values only the current balance sheet and does not incorporate the
growth assumptions that are used in the net interest income simulation model. As with the net interest income simulation
model, assumptions about the timing and variability of balance sheet cash flows are critical in the EVE analysis. Particularly
important are the assumptions driving prepayments and the expected changes in balances and pricing of the indeterminate
deposit portfolios.
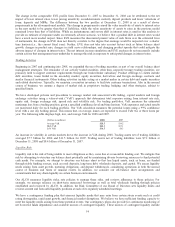
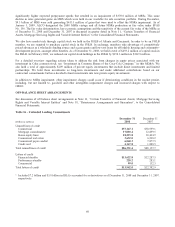
We have implemented a new vendor risk management model for analysis of residential mortgage loans and home equity
loans and lines. Cash flows of these portfolios are particularly reliant on prepayment assumptions and we believe the new
model offers a more robust and granular prepayment model relative to the previous model. Further, the new model is able to
provide daily analysis using updated market information, thus enhancing the risk management process. For these reasons,
cash flow sensitivity analysis of trading securities and securities available for sale, issued public debt securities, derivatives,
residential mortgage loans, home equity lines, and MSRs has also been transitioned to the new model. Comparable EVE
profiles as of December 31, 2008 using both models are provided, in addition to prior year information under the previous
model.
New Model
Rate Shock
(Basis Points) Estimated % Change in EVE
December 31, 2008
+100 (4.2%)
-100 1.8%
Previous Model
Rate Change
(Basis Points) Estimated % Change in EVE
December 31, 2008 December 31, 2007
+100 1.4% (2.8%)
-100 (0.7%) (1.2%)
53