SunTrust 2008 Annual Report Download - page 100
Download and view the complete annual report
Please find page 100 of the 2008 SunTrust annual report below. You can navigate through the pages in the report by either clicking on the pages listed below, or by using the keyword search tool below to find specific information within the annual report.-
 1
1 -
2
-
3
-
4
-
5
-
6
-
7
-
8
-
9
-
10
-
11
-
12
-
13
-
14
-
15
-
16
-
17
-
18
-
19
-
20
-
21
-
22
-
23
-
24
-
25
-
26
-
27
-
28
-
29
-
30
-
31
-
32
-
33
-
34
-
35
-
36
-
37
-
38
-
39
-
40
-
41
-
42
-
43
-
44
-
45
-
46
-
47
-
48
-
49
-
50
-
51
-
52
-
53
-
54
-
55
-
56
-
57
-
58
-
59
-
60
-
61
-
62
-
63
-
64
-
65
-
66
-
67
-
68
-
69
-
70
-
71
-
72
-
73
-
74
-
75
-
76
-
77
-
78
-
79
-
80
-
81
-
82
-
83
-
84
-
85
-
86
-
87
-
88
-
89
-
 90
90 -
 91
91 -
 92
92 -
 93
93 -
 94
94 -
 95
95 -
 96
96 -
 97
97 -
 98
98 -
 99
99 -
 100
100 -
 101
101 -
 102
102 -
 103
103 -
 104
104 -
 105
105 -
 106
106 -
 107
107 -
 108
108 -
 109
109 -
 110
110 -
111
-
112
-
113
-
114
-
115
-
116
-
117
-
118
-
119
-
120
-
121
-
122
-
123
-
124
-
125
-
126
-
127
-
128
-
129
-
130
-
131
-
132
-
133
-
134
-
135
-
136
-
137
-
138
-
139
-
140
-
141
-
142
-
143
-
144
-
145
-
146
-
147
-
148
-
149
-
150
-
151
-
152
-
153
-
154
-
155
-
156
-
157
-
158
-
159
-
160
-
161
-
162
-
163
-
164
-
165
-
166
-
167
-
168
-
169
-
170
-
171
-
172
-
173
-
174
-
175
-
176
-
177
-
178
-
179
-
180
-
181
-
182
-
183
-
184
-
185
-
186
-
187
-
188
 |
 |
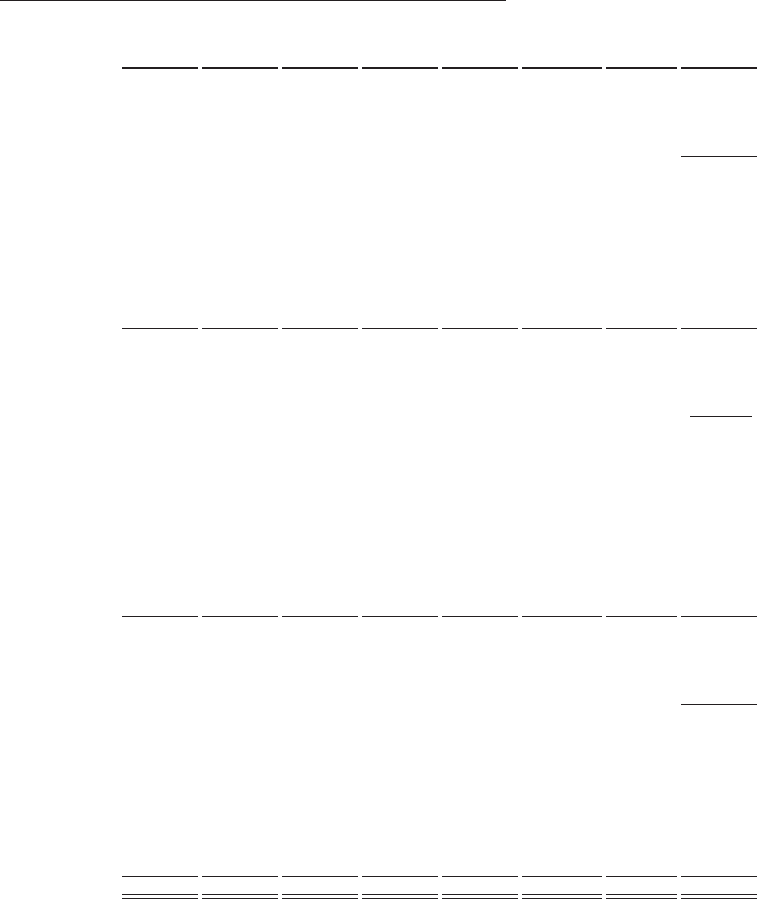
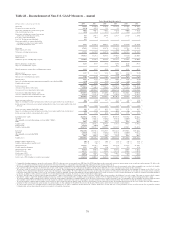
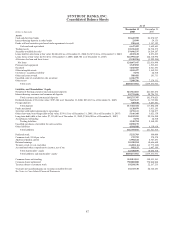
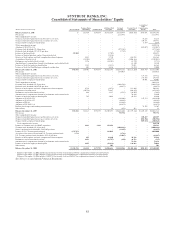
SUNTRUST BANKS, INC.
Consolidated Statements of Shareholders’ Equity
(Dollars and shares in thousands) Preferred Stock
Common Shares
Outstanding Common Stock
Additional Paid
in Capital
Retained
Earnings
Treasury Stock
and Other1
Accumulated
Other
Comprehensive
Income Total
Balance, January 1, 2006 $- 361,984 $370,578 $6,761,684 $9,310,978 ($493,936) $938,091 $16,887,395
Net income - - - - 2,117,471 - - 2,117,471
Other comprehensive income:
Change in unrealized gains (losses) on derivatives, net of tax - - - - - - 36,235 36,235
Change in unrealized gains (losses) on securities, net of tax - - - - - - 330,771 330,771
Change related to employee benefit plans - - - - - - 5,879 5,879
Total comprehensive income - - - - - - 2,490,356
Adoption of SFAS No. 158 - - - - - - (385,027) (385,027)
Common stock dividends, $2.44 per share - - - - (879,568) - - (879,568)
Preferred stock dividends, $1,548.78 per share - - - - (7,729) - - (7,729)
Issuance of preferred stock 500,000 - - (7,705) - - - 492,295
Issuance of forward purchase contract for preferred stock - - - (9,416) - - - (9,416)
Exercise of stock options and stock compensation element expense - 3,481 - 9,710 - 226,858 - 236,568
Acquisition of treasury stock - (13,102) - (98,877) - (1,006,166) - (1,105,043)
Performance and restricted stock activity - 1,196 - (24,503) - 18,770 - (5,733)
Amortization of compensation element of performance and restricted stock - - - - - 18,340 - 18,340
Issuance of stock for employee benefit plans - 1,141 - (5,913) - 72,081 - 66,168
Issuance of stock for BancMortgage contingent consideration - 203 - 2,216 - 12,784 - 15,000
Balance, December 31, 2006 $500,000 354,903 $370,578 $6,627,196 $10,541,152 ($1,151,269) $925,949 $17,813,606
Net income - - - - 1,634,015 - - 1,634,015
Other comprehensive income:
Change in unrealized gains (losses) on derivatives, net of tax - - - - - - 139,732 139,732
Change in unrealized gains (losses) on securities, net of tax - - - - - - 243,986 243,986
Change related to employee benefit plans - - - - - - 70,401 70,401
Total comprehensive income 2,088,134
Common stock dividends, $2.92 per share - - - - (1,026,594) - - (1,026,594)
Preferred stock dividends, $6,055.02 per share - - - - (30,275) - - (30,275)
Exercise of stock options and stock compensation element expense - 2,794 - (1,471) - 211,460 - 209,989
Acquisition of treasury stock - (10,758) - 71,267 - (924,652) - (853,385)
Performance and restricted stock activity - 682 - 8,197 (3,535) (10,507) - (5,845)
Amortization of compensation element of performance and restricted stock - - - - - 34,820 - 34,820
Issuance of stock for employee benefit plans - 785 - 2,046 - 60,594 - 62,640
Adoption of SFAS No. 159 - - - - (388,604) - 147,374 (241,230)
Adoption of SFAS No. 157 - - - - (10,943) - - (10,943)
Adoption of FIN 48 - - - - (41,844) - - (41,844)
Adoption of FSP FAS 13-2 - - - - (26,273) - - (26,273)
Pension plan changes and resulting remeasurement - - - - - - 79,707 79,707
Other activity - 5 - 58 (459) 412 - 11
Balance, December 31, 2007 $500,000 348,411 $370,578 $6,707,293 $10,646,640 ($1,779,142) $1,607,149 $18,052,518
Net income - - - - 795,774 - - 795,774
Other comprehensive income:
Change in unrealized gains (losses) on derivatives, net of tax - - - - - - 688,487 688,487
Change in unrealized gains (losses) on securities, net of tax - - - - - - (806,586) (806,586)
Change related to employee benefit plans - - - - - - (507,925) (507,925)
Total comprehensive income 169,750
Issuance of common stock for GB&T acquisition - 2,221 2,221 152,292 - - - 154,513
Common stock dividends, $2.85 per share - - - - (1,004,146) - - (1,004,146)
Series A preferred stock dividends, $4,451.05 per share - - - - (22,255) - - (22,255)
Issuance of U.S. Treasury preferred stock 4,717,971 - - 132,029 - - - 4,850,000
Accretion of discount associated with U.S. Treasury preferred stock 3,732 - - (3,732) -
U.S. Treasury preferred stock dividends, $471.07 per share - - - - (22,847) - - (22,847)
Exercise of stock options and stock compensation element expense - 495 - 16,160 - 39,766 - 55,926
Performance and restricted stock activity - 1,693 - (46,797) (450) 46,712 - (535)
Amortization of compensation element of performance and restricted stock - - - - - 76,656 - 76,656
Issuance of stock for employee benefit plans - 1,695 - (56,834) - 134,862 - 78,028
Other activity - - - 501 - - - 501
Balance, December 31, 2008 $5,221,703 354,515 $372,799 $6,904,644 $10,388,984 ($1,481,146) $981,125 $22,388,109
1Balance at December 31, 2008 includes $1,367,752 for treasury stock and $113,394 for compensation element of restricted stock.
Balance at December 31, 2007 includes $1,688,521 for treasury stock and $90,622 for compensation element of restricted stock.
Balance at December 31, 2006 includes $1,090,782 for treasury stock and $60,487 for compensation element of restricted stock.
See Notes to Consolidated Financial Statements.
88