SunTrust 2008 Annual Report Download - page 36
Download and view the complete annual report
Please find page 36 of the 2008 SunTrust annual report below. You can navigate through the pages in the report by either clicking on the pages listed below, or by using the keyword search tool below to find specific information within the annual report.-
 1
1 -
2
-
3
-
4
-
5
-
6
-
7
-
8
-
9
-
10
-
11
-
12
-
13
-
14
-
15
-
16
-
17
-
18
-
19
-
20
-
21
-
22
-
23
-
24
-
25
-
 26
26 -
 27
27 -
 28
28 -
 29
29 -
 30
30 -
 31
31 -
 32
32 -
 33
33 -
 34
34 -
 35
35 -
 36
36 -
 37
37 -
 38
38 -
 39
39 -
 40
40 -
 41
41 -
 42
42 -
 43
43 -
 44
44 -
 45
45 -
 46
46 -
47
-
48
-
49
-
50
-
51
-
52
-
53
-
54
-
55
-
56
-
57
-
58
-
59
-
60
-
61
-
62
-
63
-
64
-
65
-
66
-
67
-
68
-
69
-
70
-
71
-
72
-
73
-
74
-
75
-
76
-
77
-
78
-
79
-
80
-
81
-
82
-
83
-
84
-
85
-
86
-
87
-
88
-
89
-
90
-
91
-
92
-
93
-
94
-
95
-
96
-
97
-
98
-
99
-
100
-
101
-
102
-
103
-
104
-
105
-
106
-
107
-
108
-
109
-
110
-
111
-
112
-
113
-
114
-
115
-
116
-
117
-
118
-
119
-
120
-
121
-
122
-
123
-
124
-
125
-
126
-
127
-
128
-
129
-
130
-
131
-
132
-
133
-
134
-
135
-
136
-
137
-
138
-
139
-
140
-
141
-
142
-
143
-
144
-
145
-
146
-
147
-
148
-
149
-
150
-
151
-
152
-
153
-
154
-
155
-
156
-
157
-
158
-
159
-
160
-
161
-
162
-
163
-
164
-
165
-
166
-
167
-
168
-
169
-
170
-
171
-
172
-
173
-
174
-
175
-
176
-
177
-
178
-
179
-
180
-
181
-
182
-
183
-
184
-
185
-
186
-
187
-
188
 |
 |

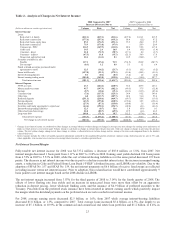
real estate home equity lines. The increase in commercial loan balances was driven by increased utilization of lines of credit
by our larger corporate clients due to dislocation in commercial paper and bond markets during 2008. The increases in
commercial, commercial real estate, and real estate home equity lines were partially offset by the decline in real estate
construction loans of $2.7 billion, or 19.9%, due to our efforts to reduce our exposure to construction loans and transfers to
nonaccrual status. Average loans held for sale were $5.1 billion, a decrease of $5.7 billion, or 52.7%, as mortgage loan
originations declined 37.6%. Production shifted to predominantly agency products and efficiency improved in loan delivery.
Average investment securities available for sale increased $1.9 billion, or 17.1%, while average interest earning trading
assets declined by $4.4 billion, or 36.6%. Despite the decline in trading assets, we have continued to actively use this
portfolio as part of our overall asset/liability management.
Average consumer and commercial deposits increased $3.3 billion, or 3.4%, year over year. This included increases of $3.9
billion, or 17.1%, in money market accounts and $1.0 billion, or 5.2%, in NOW accounts. These were partially offset by
decreases of $0.8 billion, or 18.2%, in savings and $0.7 billion, or 3.4%, in demand deposits. The change in deposit mix
represents a migration among clients from lower yielding accounts to higher yielding accounts in response to the decline in
market rates. The growth in money market accounts was influenced by sales strategies in which money market products were
used as a lead product to help retain a greater portion of maturing time deposits and other account balances. The overall
growth in consumer and commercial deposits, coupled with the $2.2 billion, or 10.6%, increase in lower cost long-term debt,
enabled a reduction in higher cost funding sources of $8.0 billion, or 23.4%. The decline in funding sources is primarily
related to a $5.6 billion decrease in brokered deposits and a $1.5 billion decrease in average foreign deposits. We continue to
pursue deposit growth initiatives utilizing product promotions to increase our presence in specific markets within our
footprint. Overall, competition for deposits remains strong as our competitors attempt to satisfy funding needs in light of the
liquidity issues prevailing in the market. As a result, we are facing significant deposit pricing pressure across our footprint.
Despite these challenging market conditions, we have used a combination of regional and product-specific pricing initiatives
to reduce our rates more aggressively than our peer banks, while still growing our average deposit balances.
The 2008 market environment began with a flat yield curve and steepened throughout the year. The Fed Funds target rate
averaged 2.08% for 2008, a decrease of 297 basis points compared to 2007. One-month LIBOR decreased 257 basis points to
2.68%, three-month LIBOR decreased 237 basis points to 2.93%, five-year swaps decreased 132 basis points to 3.69% and
ten-year swaps decreased 100 basis points to 4.24% compared to prior year. Deposit rates, our most significant funding
source, tend to track movements in one-month LIBOR, while our fixed loan yields tend to track movements in the five-year
swap rate.
Foregone interest income from nonperforming loans had a negative impact of 14 basis points on net interest margin in 2008
compared to four basis points of negative impact in 2007, as average nonaccrual loans increased $1.9 billion, or 228.4%,
over 2007. Table 1 contains more detailed information concerning average loans, yields and rates paid.
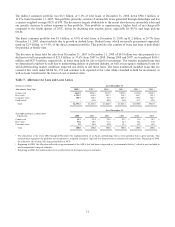
Predicting the movement in net interest margin during 2009 would be difficult given the continued volatility in interest rates,
the relatively low level of interest rates, and competitive dynamics for raising deposits. However, we believe the risks to the
net interest margin in 2009 of deposit pricing, rate compression, nonperforming asset levels, and asset mix will outweigh the
primary opportunity associated with deposit volume and mix.
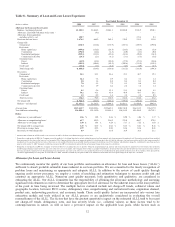
Table 3 - Noninterest Income
Year Ended December 31
(Dollars in millions) 2008 2007 2006 2005 2004 2003
Service charges on deposit accounts $904.1 $822.0 $763.7 $772.5 $700.0 $643.1
Trust and investment management income 592.3 685.0 686.9 673.7 586.8 502.4
Retail investment services 289.1 278.0 234.0 213.3 192.8 161.8
Other charges and fees 510.8 479.1 462.1 456.5 390.5 326.3
Card fees 308.4 280.7 247.6 210.8 153.4 119.6
Investment banking income 236.5 214.9 230.6 216.5 206.7 192.5
Trading account profits/(losses) and commissions 38.2 (361.7) 113.0 145.1 127.8 109.9
Mortgage production related income 171.4 91.0 217.4 144.9 57.8 150.1
Mortgage servicing related income/(expense) (211.8) 195.4 121.7 41.9 11.1 (177.5)
Gain on sale of businesses 198.1 32.3 112.8 23.4 - -
Gain on Visa IPO 86.3 -----
Net gain on sale/leaseback of premises 37.0 118.8 ----
Other income 239.8 350.1 329.1 263.6 219.2 150.9
Total noninterest income before
net securities gains/(losses) 3,400.2 3,185.6 3,518.9 3,162.2 2,646.1 2,179.1
Net securities gains/(losses) 1,073.3 243.1 (50.5) (7.2) (41.7) 123.9
Total noninterest income $4,473.5 $3,428.7 $3,468.4 $3,155.0 $2,604.4 $2,303.0
24