SunTrust 2008 Annual Report Download - page 171
Download and view the complete annual report
Please find page 171 of the 2008 SunTrust annual report below. You can navigate through the pages in the report by either clicking on the pages listed below, or by using the keyword search tool below to find specific information within the annual report.-
 1
1 -
2
-
3
-
4
-
5
-
6
-
7
-
8
-
9
-
10
-
11
-
12
-
13
-
14
-
15
-
16
-
17
-
18
-
19
-
20
-
21
-
22
-
23
-
24
-
25
-
26
-
27
-
28
-
29
-
30
-
31
-
32
-
33
-
34
-
35
-
36
-
37
-
38
-
39
-
40
-
41
-
42
-
43
-
44
-
45
-
46
-
47
-
48
-
49
-
50
-
51
-
52
-
53
-
54
-
55
-
56
-
57
-
58
-
59
-
60
-
61
-
62
-
63
-
64
-
65
-
66
-
67
-
68
-
69
-
70
-
71
-
72
-
73
-
74
-
75
-
76
-
77
-
78
-
79
-
80
-
81
-
82
-
83
-
84
-
85
-
86
-
87
-
88
-
89
-
90
-
91
-
92
-
93
-
94
-
95
-
96
-
97
-
98
-
99
-
100
-
101
-
102
-
103
-
104
-
105
-
106
-
107
-
108
-
109
-
110
-
111
-
112
-
113
-
114
-
115
-
116
-
117
-
118
-
119
-
120
-
121
-
122
-
123
-
124
-
125
-
126
-
127
-
128
-
129
-
130
-
131
-
132
-
133
-
134
-
135
-
136
-
137
-
138
-
139
-
140
-
141
-
142
-
143
-
144
-
145
-
146
-
147
-
148
-
149
-
150
-
151
-
152
-
153
-
154
-
155
-
156
-
157
-
158
-
159
-
160
-
 161
161 -
 162
162 -
 163
163 -
 164
164 -
 165
165 -
 166
166 -
 167
167 -
 168
168 -
 169
169 -
 170
170 -
 171
171 -
 172
172 -
 173
173 -
 174
174 -
 175
175 -
 176
176 -
 177
177 -
 178
178 -
 179
179 -
 180
180 -
 181
181 -
182
-
183
-
184
-
185
-
186
-
187
-
188
 |
 |

SUNTRUST BANKS, INC.
Notes to Consolidated Financial Statements (Continued)
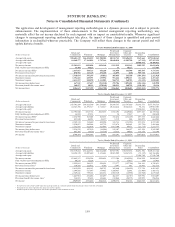
The application and development of management reporting methodologies is a dynamic process and is subject to periodic
enhancements. The implementation of these enhancements to the internal management reporting methodology may
materially affect the net income disclosed for each segment with no impact on consolidated results. Whenever significant
changes to management reporting methodologies take place, the impact of these changes is quantified and prior period
information is reclassified wherever practicable. The Company will reflect these changes in the current period and will
update historical results.
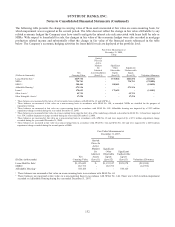
Twelve Months Ended December 31, 2008
(Dollars in thousands)
Retail and
Commercial Wholesale Mortgage
Wealth and
Investment
Management
Corporate
Other and
Treasury
Reconciling
Items Consolidated
Average total assets $58,603,247 $46,454,855 $41,980,502 $8,943,745 $19,696,253 $169,663 $175,848,265
Average total liabilities 84,460,577 17,261,054 2,767,244 10,040,018 42,905,700 (67,239) 157,367,354
Average total equity - - - - - 18,480,911 18,480,911
Net interest income $2,582,613 $499,898 $456,268 $331,919 $143,363 $605,595 $4,619,656
Fully taxable-equivalent adjustment (FTE) 34,404 64,825 - 31 18,227 - 117,487
Net interest income (FTE)12,617,017 564,723 456,268 331,950 161,590 605,595 4,737,143
Provision for loan losses2878,983 167,429 491,280 26,895 (160) 909,788 2,474,215
Net interest income after provision for loan losses 1,738,034 397,294 (35,012) 305,055 161,750 (304,193) 2,262,928
Noninterest income 1,352,665 649,193 435,954 951,466 1,098,433 (14,248) 4,473,463
Noninterest expense 2,623,157 818,870 1,333,082 960,735 168,782 (14,225) 5,890,401
Net income/(loss) before taxes 467,542 227,617 (932,140) 295,786 1,091,401 (304,216) 845,990
Provision (benefit) for income taxes3160,917 10,322 (370,360) 108,921 260,799 (120,382) 50,216
Net income/(loss) $306,625 $217,295 ($561,780) $186,865 $830,602 ($183,834) $795,774
Twelve Months Ended December 31, 2007
(Dollars in thousands)
Retail and
Commercial Wholesale Mortgage
Wealth and
Investment
Management
Corporate
Other and
Treasury
Reconciling
Items Consolidated
Average total assets $58,591,299 $39,421,580 $45,554,067 $8,898,787 $23,747,010 $1,582,775 $177,795,518
Average total liabilities 84,525,396 12,391,317 2,718,817 10,434,414 49,821,210 96,351 159,987,505
Average total equity - - - - - 17,808,013 17,808,013
Net interest income $2,798,040 $517,752 $523,253 $352,198 ($169,026) $697,327 $4,719,544
Fully taxable-equivalent adjustment (FTE) 36,910 47,851 - 54 17,837 28 102,680
Net interest income (FTE)12,834,950 565,603 523,253 352,252 (151,189) 697,355 4,822,224
Provision for loan losses2285,840 46,923 81,157 8,519 404 242,079 664,922
Net interest income after provision for loan losses 2,549,110 518,680 442,096 343,733 (151,593) 455,276 4,157,302
Noninterest income 1,250,027 480,964 365,752 812,874 542,863 (23,796) 3,428,684
Noninterest expense 2,562,938 812,434 823,946 1,013,500 44,673 (23,714) 5,233,777
Net income/(loss) before taxes 1,236,199 187,210 (16,098) 143,107 346,597 455,194 2,352,209
Provision (benefit) for income taxes3445,705 (8,876) (21,539) 54,816 89,918 158,170 718,194
Net income $790,494 $196,086 $5,441 $88,291 $256,679 $297,024 $1,634,015
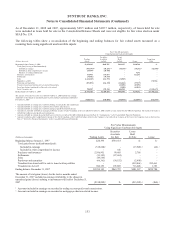
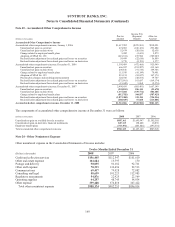
Twelve Months Ended December 31, 2006
(Dollars in thousands)
Retail and
Commercial Wholesale Mortgage
Wealth and
Investment
Management
Corporate
Other and
Treasury
Reconciling
Items Consolidated
Average total assets $58,519,264 $38,268,531 $42,014,600 $8,927,391 $30,553,856 $2,031,504 $180,315,146
Average total liabilities 84,394,130 12,007,649 2,151,683 10,021,909 54,267,154 (74,119) 162,768,406
Average total equity - - - - - 17,546,740 17,546,740
Net interest income $2,889,337 $554,326 $598,491 $373,306 ($143,225) $388,230 $4,660,465
Fully taxable-equivalent adjustment (FTE) 40,278 32,229 - 71 15,437 (49) 87,966
Net interest income (FTE)12,929,615 586,555 598,491 373,377 (127,788) 388,181 4,748,431
Provision for loan losses2110,595 122,412 8,748 3,697 641 16,443 262,536
Net interest income after provision for loan losses 2,819,020 464,143 589,743 369,680 (128,429) 371,738 4,485,895
Noninterest income 1,194,605 767,087 379,425 1,100,467 52,692 (25,904) 3,468,372
Noninterest expense 2,549,641 759,148 601,671 1,007,310 (13,950) (23,960) 4,879,860
Net income/(loss) before taxes 1,463,984 472,082 367,497 462,837 (61,787) 369,794 3,074,407
Provision (benefit) for income taxes3534,055 95,652 124,681 172,064 (98,575) 129,059 956,936
Net income $929,929 $376,430 $242,816 $290,773 $36,788 $240,735 $2,117,471
1Net interest income is fully taxable-equivalent and is presented on a matched maturity funds transfer price basis for the line of business.
2Provision for loan losses represents net charge-offs for the segments.
3Includes regular income tax provision and taxable-equivalent income adjustment reversal.
159