SunTrust 2008 Annual Report Download - page 175
Download and view the complete annual report
Please find page 175 of the 2008 SunTrust annual report below. You can navigate through the pages in the report by either clicking on the pages listed below, or by using the keyword search tool below to find specific information within the annual report.-
 1
1 -
2
-
3
-
4
-
5
-
6
-
7
-
8
-
9
-
10
-
11
-
12
-
13
-
14
-
15
-
16
-
17
-
18
-
19
-
20
-
21
-
22
-
23
-
24
-
25
-
26
-
27
-
28
-
29
-
30
-
31
-
32
-
33
-
34
-
35
-
36
-
37
-
38
-
39
-
40
-
41
-
42
-
43
-
44
-
45
-
46
-
47
-
48
-
49
-
50
-
51
-
52
-
53
-
54
-
55
-
56
-
57
-
58
-
59
-
60
-
61
-
62
-
63
-
64
-
65
-
66
-
67
-
68
-
69
-
70
-
71
-
72
-
73
-
74
-
75
-
76
-
77
-
78
-
79
-
80
-
81
-
82
-
83
-
84
-
85
-
86
-
87
-
88
-
89
-
90
-
91
-
92
-
93
-
94
-
95
-
96
-
97
-
98
-
99
-
100
-
101
-
102
-
103
-
104
-
105
-
106
-
107
-
108
-
109
-
110
-
111
-
112
-
113
-
114
-
115
-
116
-
117
-
118
-
119
-
120
-
121
-
122
-
123
-
124
-
125
-
126
-
127
-
128
-
129
-
130
-
131
-
132
-
133
-
134
-
135
-
136
-
137
-
138
-
139
-
140
-
141
-
142
-
143
-
144
-
145
-
146
-
147
-
148
-
149
-
150
-
151
-
152
-
153
-
154
-
155
-
156
-
157
-
158
-
159
-
160
-
161
-
162
-
163
-
164
-
 165
165 -
 166
166 -
 167
167 -
 168
168 -
 169
169 -
 170
170 -
 171
171 -
 172
172 -
 173
173 -
 174
174 -
 175
175 -
 176
176 -
 177
177 -
 178
178 -
 179
179 -
 180
180 -
 181
181 -
 182
182 -
 183
183 -
 184
184 -
 185
185 -
186
-
187
-
188
 |
 |

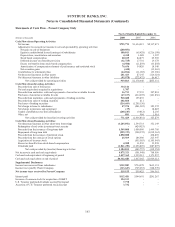
SUNTRUST BANKS, INC.
Notes to Consolidated Financial Statements (Continued)
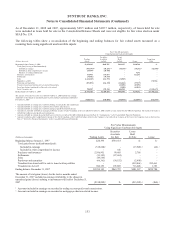
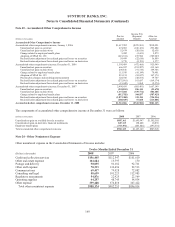
Statements of Cash Flow – Parent Company Only
Twelve Months Ended December 31
(Dollars in thousands) 2008 2007 2006
Cash Flows from Operating Activities:
Net income $795,774 $1,634,015 $2,117,471
Adjustments to reconcile net income to net cash provided by operating activities:
Net gain on sale of businesses (200,851) --
Equity in undistributed losses/(earnings) of subsidiaries 180,013 (65,428) (1,216,198)
Depreciation, amortization and accretion 4,410 1,028 1,907
Stock based compensation 20,185 24,275 25,969
Deferred income tax (benefit) provision (32,725) 17,701 19,378
Excess tax benefits from stock-based compensation (4,580) (11,259) (33,258)
Amortization of compensation element of performance and restricted stock 76,656 34,820 18,340
Net securities gains (448) - (15,065)
Contributions to retirement plans (64,016) (11,185) (33,306)
Net decrease/(increase) in other assets 241,423 27,145 (116,324)
Net (decrease)/increase in other liabilities (95,978) (272,472) 86,417
Net cash provided by operating activities 919,863 $1,378,640 $855,331
Cash Flows from Investing Activities:
Proceeds from sale of businesses 314,146 --
Net cash equivalents acquired in acquisitions 1,707 --
Proceeds from maturities, calls and repayments of securities available for sale 16,713 37,355 307,801
Purchases of securities available for sale (47,237) (214,005) (121,836)
Proceeds from maturities, calls and repayments of trading securities 518,600 195,235 -
Proceeds from sales of trading securities 402,020 211 -
Purchases of trading securities (214,693) (1,205,136) -
Net change in loans to subsidiaries 47,574 (241,583) 123,372
Net change in premises and equipment (39) - 12,823
Capital contributions (to)/from subsidiaries (268,245) (9,812) 2,105
Other, net 883 904 1,014
Net cash provided by/(used in) investing activities 771,429 (1,436,831) 325,279
Cash Flows from Financing Activities:
Net (decrease)/increase in other short-term borrowings (1,245,076) 1,594,733 351,149
Redemption of real estate investment trust security -(424,923) -
Proceeds from the issuance of long-term debt 1,549,800 1,000,000 1,499,700
Repayment of long-term debt (959,372) (900,572) (1,012,563)
Proceeds from the issuance of preferred stock 4,850,000 - 492,295
Proceeds from the exercise of stock options 25,569 186,000 215,947
Acquisition of treasury stock -(853,385) (1,105,043)
Excess tax benefits from stock-based compensation 4,580 11,259 33,258
Dividends paid (1,041,470) (1,056,869) (887,297)
Net cash provided by/(used in) financing activities 3,184,031 (443,757) (412,554)
Net increase in cash and cash equivalents 4,875,323 (501,948) 768,056
Cash and cash equivalents at beginning of period 1,437,365 1,939,313 1,171,257
Cash and cash equivalents at end of period $6,312,688 1,437,365 $1,939,313
Supplemental Disclosures:
Income taxes received from subsidiaries $332,802 $734,078 $615,131
Income taxes paid by Parent Company (313,647) (703,653) (548,570)
Net income taxes received by Parent Company $19,155 $30,425 $66,561
Interest paid $332,481 $344,691 $291,267
Issuance of common stock for acquisition of GB&T 154,513 --
U.S. Treasury preferred dividends accrued but unpaid 7,778 --
Accretion of U.S. Treasury preferred stock discount 3,732 --
163