SunTrust 2008 Annual Report Download - page 126
Download and view the complete annual report
Please find page 126 of the 2008 SunTrust annual report below. You can navigate through the pages in the report by either clicking on the pages listed below, or by using the keyword search tool below to find specific information within the annual report.-
 1
1 -
2
-
3
-
4
-
5
-
6
-
7
-
8
-
9
-
10
-
11
-
12
-
13
-
14
-
15
-
16
-
17
-
18
-
19
-
20
-
21
-
22
-
23
-
24
-
25
-
26
-
27
-
28
-
29
-
30
-
31
-
32
-
33
-
34
-
35
-
36
-
37
-
38
-
39
-
40
-
41
-
42
-
43
-
44
-
45
-
46
-
47
-
48
-
49
-
50
-
51
-
52
-
53
-
54
-
55
-
56
-
57
-
58
-
59
-
60
-
61
-
62
-
63
-
64
-
65
-
66
-
67
-
68
-
69
-
70
-
71
-
72
-
73
-
74
-
75
-
76
-
77
-
78
-
79
-
80
-
81
-
82
-
83
-
84
-
85
-
86
-
87
-
88
-
89
-
90
-
91
-
92
-
93
-
94
-
95
-
96
-
97
-
98
-
99
-
100
-
101
-
102
-
103
-
104
-
105
-
106
-
107
-
108
-
109
-
110
-
111
-
112
-
113
-
114
-
115
-
 116
116 -
 117
117 -
 118
118 -
 119
119 -
 120
120 -
 121
121 -
 122
122 -
 123
123 -
 124
124 -
 125
125 -
 126
126 -
 127
127 -
 128
128 -
 129
129 -
 130
130 -
 131
131 -
 132
132 -
 133
133 -
 134
134 -
 135
135 -
 136
136 -
137
-
138
-
139
-
140
-
141
-
142
-
143
-
144
-
145
-
146
-
147
-
148
-
149
-
150
-
151
-
152
-
153
-
154
-
155
-
156
-
157
-
158
-
159
-
160
-
161
-
162
-
163
-
164
-
165
-
166
-
167
-
168
-
169
-
170
-
171
-
172
-
173
-
174
-
175
-
176
-
177
-
178
-
179
-
180
-
181
-
182
-
183
-
184
-
185
-
186
-
187
-
188
 |
 |

SUNTRUST BANKS, INC.
Notes to Consolidated Financial Statements (Continued)
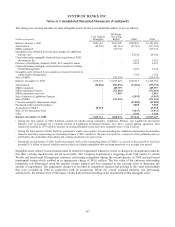
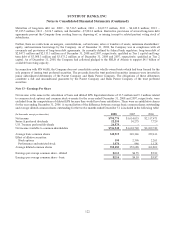
Portfolio balances, delinquency balances based on 90 days or more past due, and net charge-offs related to managed portfolio
loans as of and for the years ending December 31, 2008 and 2007 are as follows:
Principal Balance Past Due Net Charge-offs
(Dollars in millions) 2008 2007 2008 2007 2008 2007
Type of loan:
Commercial $41,039.9 $35,929.4 $340.9 $100.7 $194.6 $110.3
Residential mortgage and home equity 48,520.2 47,691.3 2,727.6 1,324.2 950.5 216.0
Commercial real estate and construction 24,821.1 26,386.2 1,492.6 373.7 215.2 11.2
Consumer 11,646.9 11,458.0 411.1 242.8 172.4 79.0
Credit card 970.3 854.1 --31.6 6.3
Total loan portfolio $126,998.4 $122,319.0 $4,972.2 $2,041.4 $1,564.3 $422.8
Managed securitized loans
Commercial $3,766.8 $4,416.6 $30.2 $- $- $-
Residential mortgage 1,723.2 2,069.1 128.2 77.4 24.3 3.3
Commercial real estate and construction -420.4 ----
Other 565.2 595.8 61.6 62.1 0.3 0.3
Total managed loans $133,053.6 $129,820.9 $5,192.2 $2,180.9 $1,588.9 $426.4
Residential mortgage loans securitized through Ginnie Mae, Fannie Mae, and Freddie Mac have been excluded from the
tables above since the Company does not retain any beneficial interests or other continuing involvement in the loans other
than servicing responsibilities and repurchase contingencies under standard representations and warrantees made with respect
to the transferred mortgage loans. The total amount of loans serviced by the Company as a result of such securitization
transactions totaled $106.6 billion and $90.3 billion at December 31, 2008 and 2007, respectively. Related servicing fees
received by the Company during 2008, 2007, and 2006 were $293.9 million, $263.2 million, and $209.5 million,
respectively.
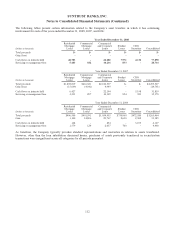
Mortgage Servicing Rights
In addition to other interests that continue to be held by the Company in the form of securities, the Company also retains
MSRs from certain of its sales or securitizations of residential mortgage loans. MSRs on residential mortgage loans are the
Company’s only class of servicing assets and are reported at amortized cost, net of any allowance for impairment losses. As
of December 31, 2008, the Company had not elected to carry any of its MSRs at fair value, although the Company did create
a new MSRs class on January 1, 2009 that will be reported at fair value as discussed in Note 1, “Significant Accounting
Policies”, to the Consolidated Financial Statements.
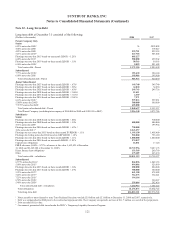
The following table provides a rollforward of the activity of MSRs, which are included in intangible assets in the
Consolidated Balance Sheets, as of December 31. Any impacts of this activity are reflected in the Company’s Consolidated
Statements of Income in mortgage servicing related income.
(Dollars in thousands) 2008 2007 2006
Balance at beginning of year $1,049,425 $810,509 $657,604
Amortization (223,092) (181,263) (195,627)
Servicing rights originated 485,597 639,158 503,801
MSRs impairment reserve (371,881) --
MSRs impairment recovery 1,881 --
Sale/securitization of MSRs (131,456) (218,979) (155,269)
Balance at end of year $810,474 $1,049,425 $810,509
Income earned by the Company on its MSRs is derived from contractually specified mortgage servicing fees and late fees.
Such income earned for the twelve months ended December 31, 2008 and 2007 was $354.3 million and $337.7 million,
respectively. These amounts are reported in mortgage servicing related income in the Consolidated Statements of Income.
114