SunTrust 2008 Annual Report Download - page 174
Download and view the complete annual report
Please find page 174 of the 2008 SunTrust annual report below. You can navigate through the pages in the report by either clicking on the pages listed below, or by using the keyword search tool below to find specific information within the annual report.-
 1
1 -
2
-
3
-
4
-
5
-
6
-
7
-
8
-
9
-
10
-
11
-
12
-
13
-
14
-
15
-
16
-
17
-
18
-
19
-
20
-
21
-
22
-
23
-
24
-
25
-
26
-
27
-
28
-
29
-
30
-
31
-
32
-
33
-
34
-
35
-
36
-
37
-
38
-
39
-
40
-
41
-
42
-
43
-
44
-
45
-
46
-
47
-
48
-
49
-
50
-
51
-
52
-
53
-
54
-
55
-
56
-
57
-
58
-
59
-
60
-
61
-
62
-
63
-
64
-
65
-
66
-
67
-
68
-
69
-
70
-
71
-
72
-
73
-
74
-
75
-
76
-
77
-
78
-
79
-
80
-
81
-
82
-
83
-
84
-
85
-
86
-
87
-
88
-
89
-
90
-
91
-
92
-
93
-
94
-
95
-
96
-
97
-
98
-
99
-
100
-
101
-
102
-
103
-
104
-
105
-
106
-
107
-
108
-
109
-
110
-
111
-
112
-
113
-
114
-
115
-
116
-
117
-
118
-
119
-
120
-
121
-
122
-
123
-
124
-
125
-
126
-
127
-
128
-
129
-
130
-
131
-
132
-
133
-
134
-
135
-
136
-
137
-
138
-
139
-
140
-
141
-
142
-
143
-
144
-
145
-
146
-
147
-
148
-
149
-
150
-
151
-
152
-
153
-
154
-
155
-
156
-
157
-
158
-
159
-
160
-
161
-
162
-
163
-
 164
164 -
 165
165 -
 166
166 -
 167
167 -
 168
168 -
 169
169 -
 170
170 -
 171
171 -
 172
172 -
 173
173 -
 174
174 -
 175
175 -
 176
176 -
 177
177 -
 178
178 -
 179
179 -
 180
180 -
 181
181 -
 182
182 -
 183
183 -
 184
184 -
185
-
186
-
187
-
188
 |
 |

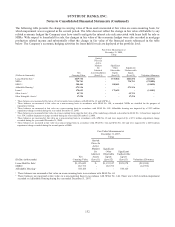
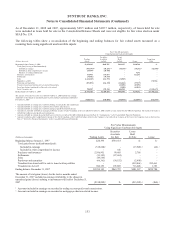
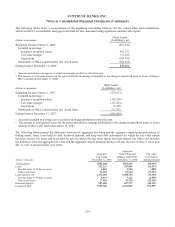
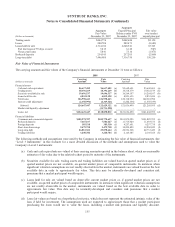
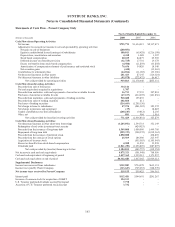
SUNTRUST BANKS, INC.
Notes to Consolidated Financial Statements (Continued)
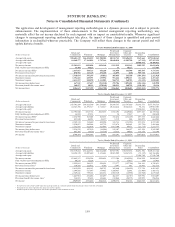
Balance Sheets - Parent Company Only
December 31
(Dollars in thousands) 2008 2007
Assets
Cash in subsidiary banks $769 $5,160
Interest-bearing deposits in other banks 6,311,919 1,432,205
Cash and cash equivalents 6,312,688 1,437,365
Trading assets 337,499 1,195,605
Securities available for sale 246,850 210,420
Loans to subsidiaries 984,303 1,031,877
Investment in capital stock of subsidiaries stated on the basis of the
Company’s equity in subsidiaries’ capital accounts:
Banking subsidiaries 20,469,508 20,668,687
Nonbanking subsidiaries 929,726 1,111,618
Premises and equipment 1,356 1,739
Goodwill 98,905 128,819
Other assets 460,310 504,705
Total assets $29,841,145 $26,290,835
Liabilities and Shareholders’ Equity
Short-term borrowings from:
Subsidiaries $86,161 $71,605
Non-affiliated companies 1,104,555 2,361,387
Long-term debt 5,676,349 5,063,620
Trading liabilities -3,364
Other liabilities 585,971 738,341
Total liabilities 7,453,036 8,238,317
Preferred stock 5,221,703 500,000
Common stock 372,799 370,578
Additional paid in capital 6,904,644 6,707,293
Retained earnings 10,388,984 10,646,640
Treasury stock, at cost, and other (1,481,146) (1,779,142)
Accumulated other comprehensive income 981,125 1,607,149
Total shareholders’ equity 22,388,109 18,052,518
Total liabilities and shareholders’ equity $29,841,145 $26,290,835
162