SunTrust 2008 Annual Report Download - page 101
Download and view the complete annual report
Please find page 101 of the 2008 SunTrust annual report below. You can navigate through the pages in the report by either clicking on the pages listed below, or by using the keyword search tool below to find specific information within the annual report.-
 1
1 -
2
-
3
-
4
-
5
-
6
-
7
-
8
-
9
-
10
-
11
-
12
-
13
-
14
-
15
-
16
-
17
-
18
-
19
-
20
-
21
-
22
-
23
-
24
-
25
-
26
-
27
-
28
-
29
-
30
-
31
-
32
-
33
-
34
-
35
-
36
-
37
-
38
-
39
-
40
-
41
-
42
-
43
-
44
-
45
-
46
-
47
-
48
-
49
-
50
-
51
-
52
-
53
-
54
-
55
-
56
-
57
-
58
-
59
-
60
-
61
-
62
-
63
-
64
-
65
-
66
-
67
-
68
-
69
-
70
-
71
-
72
-
73
-
74
-
75
-
76
-
77
-
78
-
79
-
80
-
81
-
82
-
83
-
84
-
85
-
86
-
87
-
88
-
89
-
90
-
 91
91 -
 92
92 -
 93
93 -
 94
94 -
 95
95 -
 96
96 -
 97
97 -
 98
98 -
 99
99 -
 100
100 -
 101
101 -
 102
102 -
 103
103 -
 104
104 -
 105
105 -
 106
106 -
 107
107 -
 108
108 -
 109
109 -
 110
110 -
 111
111 -
112
-
113
-
114
-
115
-
116
-
117
-
118
-
119
-
120
-
121
-
122
-
123
-
124
-
125
-
126
-
127
-
128
-
129
-
130
-
131
-
132
-
133
-
134
-
135
-
136
-
137
-
138
-
139
-
140
-
141
-
142
-
143
-
144
-
145
-
146
-
147
-
148
-
149
-
150
-
151
-
152
-
153
-
154
-
155
-
156
-
157
-
158
-
159
-
160
-
161
-
162
-
163
-
164
-
165
-
166
-
167
-
168
-
169
-
170
-
171
-
172
-
173
-
174
-
175
-
176
-
177
-
178
-
179
-
180
-
181
-
182
-
183
-
184
-
185
-
186
-
187
-
188
 |
 |

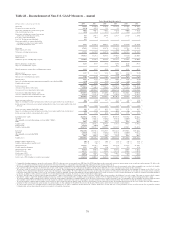
SUNTRUST BANKS, INC.
Consolidated Statements of Cash Flows
For the Year Ended December 31
(Dollars in thousands) 2008 2007 2006
Cash Flows from Operating Activities:
Net income $795,774 $1,634,015 $2,117,471
Adjustments to reconcile net income to net cash provided by operating activities:
Net gain on sale of businesses (198,140) (32,340) (112,759)
Visa litigation (33,469) 76,930 -
Expense recognized on contribution of common stock of The Coca-Cola Company 183,418 --
Depreciation, amortization and accretion 824,263 802,342 810,881
Customer relationship intangible impairment 45,000 --
Impairment of mortgage servicing rights 370,000 --
Gain on sale of mortgage servicing rights (16,931) (51,236) (66,283)
Origination of mortgage servicing rights (485,597) (639,158) (503,801)
Provisions for loan losses and foreclosed property 2,551,574 683,114 265,609
Deferred income tax (benefit) provision (221,235) (147,758) 107,966
Amortization of compensation element of performance and restricted stock 76,656 34,820 18,340
Stock option compensation 20,185 24,275 25,969
Excess tax benefits from stock-based compensation (4,580) (11,259) (33,258)
Net loss on extinguishment of debt 11,723 9,800 11,665
Net securities (gains) losses (1,073,300) (243,117) 50,477
Net gain on sale/leaseback of premises (37,039) (118,840) -
Net gain on sale of assets (60,311) (30,569) (49,285)
Originated and purchased loans held for sale net of principal collected (32,839,219) (52,762,349) (47,374,700)
Sales and securitizations of loans held for sale 37,031,057 55,241,777 49,308,909
Contributions to retirement plans (386,535) (11,185) (197,106)
Net increase in other assets (2,680,321) (1,950,167) (385,878)
Net (decrease) increase in other liabilities (173,223) 1,213,338 (208,276)
Net cash provided by operating activities 3,699,750 3,722,433 3,785,941
Cash Flows from Investing Activities:
Proceeds from maturities, calls and repayments of securities available for sale 1,292,065 1,073,340 3,914,243
Proceeds from sales of securities available for sale 5,737,627 1,199,231 4,945,870
Purchases of securities available for sale (8,170,824) (7,640,289) (6,931,905)
Proceeds from maturities, calls and repayments of trading securities 4,329,198 11,896,617 -
Proceeds from sales of trading securities 3,046,185 19,240,250 -
Purchases of trading securities (3,687,561) (22,717,152) -
Loan originations net of principal collected (5,807,828) (7,158,570) (9,490,800)
Proceeds from sale of loans 881,410 5,721,662 2,235,011
Proceeds from sale of mortgage servicing rights 148,387 270,215 211,157
Capital expenditures (221,602) (186,431) (334,254)
Net cash and cash equivalents received for sales of businesses 301,604 - 113,750
Net cash and cash equivalents paid for acquisitions (23,931) (32,200) -
Seix contingent consideration payout -(42,287) -
Proceeds from the sale/leaseback of premises 288,851 764,368 -
Proceeds from the sale of other assets 318,910 145,871 45,203
Net cash (used in) provided by investing activities (1,567,509) 2,534,625 (5,291,725)
Cash Flows from Financing Activities:
Net increase in consumer and commercial deposits 1,767,908 2,100,134 2,214,246
Net decrease in foreign and brokered deposits (7,917,898) (8,273,116) (235,055)
Assumption of First Priority Bank deposits, net 160,517 --
Net (decrease) increase in funds purchased, securities sold under agreements to
repurchase, and other short-term borrowings (2,796,359) (1,679,833) 1,568,496
Proceeds from the issuance of long-term debt 7,834,388 5,197,020 2,925,024
Repayment of long-term debt (4,024,675) (1,553,412) (4,713,948)
Proceeds from the issuance of preferred stock 4,850,000 - 492,295
Proceeds from the exercise of stock options 25,569 186,000 215,947
Acquisition of treasury stock -(853,385) (1,105,043)
Excess tax benefits from stock-based compensation 4,580 11,259 33,258
Common and preferred dividends paid (1,041,470) (1,056,869) (887,297)
Net cash (used in) provided by financing activities (1,137,440) (5,922,202) 507,923
Net increase (decrease) in cash and cash equivalents 994,801 334,856 (997,861)
Cash and cash equivalents at beginning of period 5,642,601 5,307,745 6,305,606
Cash and cash equivalents at end of period $6,637,402 $5,642,601 $5,307,745
Supplemental Disclosures:
Interest paid $3,868,034 $5,277,639 $5,088,403
Income taxes paid 341,396 724,351 709,168
Income taxes refunded (4,275) (13,859) (14,762)
Securities transferred from available for sale to trading -15,143,109 -
Loans transferred from loans to loans held for sale -4,054,246 -
Loans transferred from loans held for sale to loans 656,134 837,401 -
Issuance of common stock for acquisition of GB&T 154,513 - -
Noncash gain on contribution of common stock of the Coca-Cola Company 183,418 - -
Unsettled purchases of securities available for sale as of year-end 8,898,279 - -
Unsettled sales of securities available for sale as of year-end 6,386,795 --
Amortization of deferred gain on sale/leaseback of premises 55,616 5,301 -
U.S. Treasury preferred dividend accrued but unpaid 7,778 --
Accretion on U.S. Treasury preferred stock 3,732 --
See Notes to Consolidated Financial Statements.
89