SunTrust 2008 Annual Report Download - page 138
Download and view the complete annual report
Please find page 138 of the 2008 SunTrust annual report below. You can navigate through the pages in the report by either clicking on the pages listed below, or by using the keyword search tool below to find specific information within the annual report.-
 1
1 -
2
-
3
-
4
-
5
-
6
-
7
-
8
-
9
-
10
-
11
-
12
-
13
-
14
-
15
-
16
-
17
-
18
-
19
-
20
-
21
-
22
-
23
-
24
-
25
-
26
-
27
-
28
-
29
-
30
-
31
-
32
-
33
-
34
-
35
-
36
-
37
-
38
-
39
-
40
-
41
-
42
-
43
-
44
-
45
-
46
-
47
-
48
-
49
-
50
-
51
-
52
-
53
-
54
-
55
-
56
-
57
-
58
-
59
-
60
-
61
-
62
-
63
-
64
-
65
-
66
-
67
-
68
-
69
-
70
-
71
-
72
-
73
-
74
-
75
-
76
-
77
-
78
-
79
-
80
-
81
-
82
-
83
-
84
-
85
-
86
-
87
-
88
-
89
-
90
-
91
-
92
-
93
-
94
-
95
-
96
-
97
-
98
-
99
-
100
-
101
-
102
-
103
-
104
-
105
-
106
-
107
-
108
-
109
-
110
-
111
-
112
-
113
-
114
-
115
-
116
-
117
-
118
-
119
-
120
-
121
-
122
-
123
-
124
-
125
-
126
-
127
-
 128
128 -
 129
129 -
 130
130 -
 131
131 -
 132
132 -
 133
133 -
 134
134 -
 135
135 -
 136
136 -
 137
137 -
 138
138 -
 139
139 -
 140
140 -
 141
141 -
 142
142 -
 143
143 -
 144
144 -
 145
145 -
 146
146 -
 147
147 -
 148
148 -
149
-
150
-
151
-
152
-
153
-
154
-
155
-
156
-
157
-
158
-
159
-
160
-
161
-
162
-
163
-
164
-
165
-
166
-
167
-
168
-
169
-
170
-
171
-
172
-
173
-
174
-
175
-
176
-
177
-
178
-
179
-
180
-
181
-
182
-
183
-
184
-
185
-
186
-
187
-
188
 |
 |

SUNTRUST BANKS, INC.
Notes to Consolidated Financial Statements (Continued)
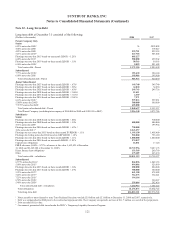
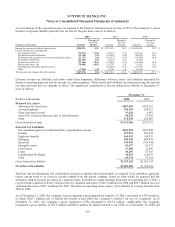
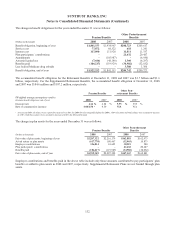
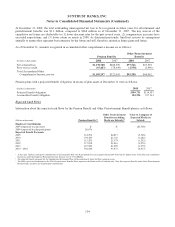
A reconciliation of the expected income tax expense at the statutory federal income tax rate of 35% to the Company’s actual
income tax expense (benefit) and effective tax rate for the past three years is as follows:
2008 2007 2006
(Dollars in thousands) Amount
Percent of
Pre-Tax
Income Amount
Percent of
Pre-Tax
Income Amount
Percent of
Pre-Tax
Income
Income tax expense at federal statutory rate $254,976 35.0 % $787,335 35.0 % $1,045,254 35.0 %
Increase (decrease) resulting from:
Tax-exempt interest (74,921) (10.2) (74,183) (3.3) (62,113) (2.1)
Dividends received deduction (13,766) (1.9) (14,949) (0.6) (14,859) (0.6)
Dividends paid on employee stock ownership plan shares (13,173) (1.8) (13,437) (0.6) (12,240) (0.4)
Charitable contribution (64,196) (8.8) (2,168) (0.1) (1,429) -
Income tax credits, net (75,164) (10.3) (75,480) (3.4) (68,646) (2.3)
State income taxes, net (74,009) (10.2) 18,578 0.8 6,201 0.2
Dividends on subsidiary preferred stock --(23,884) (1.0) (21,779) (0.7)
Other (7,018) (1.0) 13,702 0.6 (1,419) -
Total income tax expense (benefit) and rate ($67,271) (9.2) % $615,514 27.4 % $868,970 29.1 %
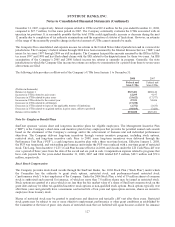
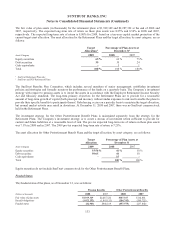
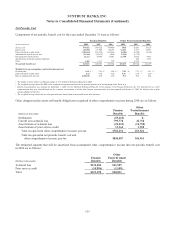
Deferred income tax liabilities and assets result from temporary differences between assets and liabilities measured for
financial reporting purposes and for income tax return purposes. These assets and liabilities are measured using the enacted
tax rates and laws that are currently in effect. The significant components of the net deferred tax liability at December 31
were as follows:
December 31,
(Dollars in thousands) 2008 2007
Deferred Tax Assets
Allowance for loan losses $887,401 $474,252
Accrued expenses 344,103 286,912
Other real estate owned 33,428 6,481
State NOL/valuation allowance (net of federal benefit) 96,524 57,499
Other 170,510 105,887
Gross deferred tax asset $1,531,966 $931,031
Deferred Tax Liabilities
Net unrealized gains in accumulated other comprehensive income $541,981 $929,048
Leasing 917,921 852,254
Employee benefits 164,053 148,529
Mortgage 485,045 484,459
Securities 143,096 (165,944)
Intangible assets 62,617 43,373
Fixed assets 67,908 33,800
Loans 44,207 87,616
Undistributed dividends 42,053 128,835
Other 64,374 97,164
Gross deferred tax liability $2,533,255 $2,639,134
Net deferred tax liability $1,001,289 $1,708,103
SunTrust and its subsidiaries file consolidated income tax returns where permissible or required. Each subsidiary generally
remits current taxes to or receives current refunds from the parent company based on what would be required had the
subsidiary filed an income tax return as a separate entity. Deferred tax assets resulting from state net operating loss (“NOL”)
carryforwards consisted of $148.5 million (net of a valuation allowance of $40.5 million) for 2008 and $88.5 million (net of a
valuation allowance of $37.1 million) for 2007. The state net operating losses expire, if not utilized, in varying amounts from
2009 to 2028.
As of December 31, 2008, the Company’s gross cumulative unrecognized tax benefits (“UTBs”) amounted to $330.0 million,
of which $266.7 million (net of federal tax benefit) would affect the Company’s effective tax rate, if recognized. As of
December 31, 2007, the Company’s gross cumulative UTBs amounted to $325.4 million. Additionally, the Company
recognized a gross liability of $70.9 million and $80.0 million for interest related to its UTBs as of December 31, 2008 and
126