Capital One 2008 Annual Report Download - page 99
Download and view the complete annual report
Please find page 99 of the 2008 Capital One annual report below. You can navigate through the pages in the report by either clicking on the pages listed below, or by using the keyword search tool below to find specific information within the annual report.-
 1
1 -
2
-
3
-
4
-
5
-
6
-
7
-
8
-
9
-
10
-
11
-
12
-
13
-
14
-
15
-
16
-
17
-
18
-
19
-
20
-
21
-
22
-
23
-
24
-
25
-
26
-
27
-
28
-
29
-
30
-
31
-
32
-
33
-
34
-
35
-
36
-
37
-
38
-
39
-
40
-
41
-
42
-
43
-
44
-
45
-
46
-
47
-
48
-
49
-
50
-
51
-
52
-
53
-
54
-
55
-
56
-
57
-
58
-
59
-
60
-
61
-
62
-
63
-
64
-
65
-
66
-
67
-
68
-
69
-
70
-
71
-
72
-
73
-
74
-
75
-
76
-
77
-
78
-
79
-
80
-
81
-
82
-
83
-
84
-
85
-
86
-
87
-
88
-
 89
89 -
 90
90 -
 91
91 -
 92
92 -
 93
93 -
 94
94 -
 95
95 -
 96
96 -
 97
97 -
 98
98 -
 99
99 -
 100
100 -
 101
101 -
 102
102 -
 103
103 -
 104
104 -
 105
105 -
 106
106 -
 107
107 -
 108
108 -
 109
109 -
110
-
111
-
112
-
113
-
114
-
115
-
116
-
117
-
118
-
119
-
120
-
121
-
122
-
123
-
124
-
125
-
126
-
127
-
128
-
129
-
130
-
131
-
132
-
133
-
134
-
135
-
136
-
137
-
138
-
139
-
140
-
141
-
142
-
143
-
144
-
145
-
146
-
147
-
148
-
149
-
150
-
151
-
152
-
153
-
154
-
155
-
156
-
157
-
158
-
159
-
160
-
161
-
162
-
163
-
164
-
165
-
166
-
167
-
168
-
169
-
170
-
171
-
172
-
173
-
174
-
175
-
176
-
177
-
178
-
179
-
180
-
181
-
182
-
183
-
184
-
185
-
186
 |
 |

81
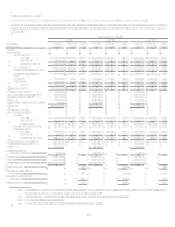
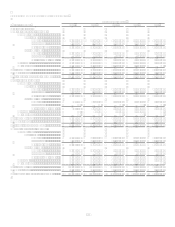
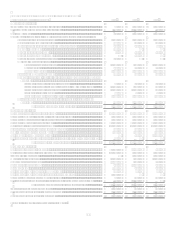
Item 8. Financial Statements and Supplementary Data
CONSOLIDATED BALANCE SHEETS
December 31 (In Thousands, Except Share and Per Share Data)
2008
2007
Assets:
Cash and due from banks.................................................................................................................
.
$ 2,047,839
$ 2,377,287
Federal funds sold and resale agreements........................................................................................
.
636,752
1,766,762
Interest bearing deposits at other banks ...........................................................................................
.
4,806,752
677,360
Cash and cash equivalents......................................................................................................
.
7,491,343
4,821,409
Securities available for sale .............................................................................................................
.
31,003,271
19,781,587
Mortgage loans held for sale............................................................................................................
.
68,462
315,863
Loans held for investment................................................................................................................
.
101,017,771
101,805,027
Less: Allowance for loan and lease losses..............................................................................
.
(4,523,960) (2,963,000)
Net loans held for investment ..........................................................................................................
.
96,493,811
98,842,027
Accounts receivable from securitizations ........................................................................................
.
6,342,754
4,717,879
Premises and equipment, net............................................................................................................
.
2,313,106
2,299,603
Interest receivable ............................................................................................................................
.
827,909
839,317
Goodwill ..........................................................................................................................................
.
11,964,487
12,830,740
Other ................................................................................................................................................
.
9,408,309
6,141,944
Total assets .............................................................................................................................
.
$ 165,913,452 $ 150,590,369
Liabilities:
Non-interest bearing deposits...........................................................................................................
.
$ 11,293,852
$ 11,046,549
Interest bearing deposits ..................................................................................................................
.
97,326,937
71,714,627
Total deposits .........................................................................................................................
.
108,620,789
82,761,176
Senior and subordinated notes .........................................................................................................
.
8,308,843
10,712,706
Other borrowings .............................................................................................................................
.
14,869,648
26,812,969
Interest payable ................................................................................................................................
.
676,398
631,609
Other ................................................................................................................................................
.
6,825,341
5,377,797
Total liabilities........................................................................................................................
.
139,301,019
126,296,257
Stockholders Equity:
Preferred stock, par value $.01 per share; authorized 50,000,000 shares; 3,555,199 issued and
outstanding; aggregate liquidation preference of $3,555,199 .....................................................
.
3,096,466
Common stock, par value $.01 per share; authorized 1,000,000,000 shares; 438,434,235 and
419,224,900 issued as of December 31, 2008 and 2007, respectively ........................................
.
4,384
4,192
Paid-in capital, net ...........................................................................................................................
.
17,278,102
15,860,490
Retained earnings.............................................................................................................................
.
10,621,164
11,267,568
Cumulative other comprehensive income (loss)..............................................................................
.
(1,221,796) 315,248
Less: Treasury stock, at cost; 46,637,241 and 46,370,635 shares as of December 31, 2008
and 2007, respectively .......................................................................................................
.
(3,165,887) (3,153,386)
Total stockholders equity ......................................................................................................
.
26,612,433
24,294,112
Total liabilities and stockholders equity................................................................................
.
$ 165,913,452 $ 150,590,369
See Notes to Consolidated Financial Statements.