Capital One 2008 Annual Report Download - page 78
Download and view the complete annual report
Please find page 78 of the 2008 Capital One annual report below. You can navigate through the pages in the report by either clicking on the pages listed below, or by using the keyword search tool below to find specific information within the annual report.-
 1
1 -
2
-
3
-
4
-
5
-
6
-
7
-
8
-
9
-
10
-
11
-
12
-
13
-
14
-
15
-
16
-
17
-
18
-
19
-
20
-
21
-
22
-
23
-
24
-
25
-
26
-
27
-
28
-
29
-
30
-
31
-
32
-
33
-
34
-
35
-
36
-
37
-
38
-
39
-
40
-
41
-
42
-
43
-
44
-
45
-
46
-
47
-
48
-
49
-
50
-
51
-
52
-
53
-
54
-
55
-
56
-
57
-
58
-
59
-
60
-
61
-
62
-
63
-
64
-
65
-
66
-
67
-
 68
68 -
 69
69 -
 70
70 -
 71
71 -
 72
72 -
 73
73 -
 74
74 -
 75
75 -
 76
76 -
 77
77 -
 78
78 -
 79
79 -
 80
80 -
 81
81 -
 82
82 -
 83
83 -
 84
84 -
 85
85 -
 86
86 -
 87
87 -
 88
88 -
89
-
90
-
91
-
92
-
93
-
94
-
95
-
96
-
97
-
98
-
99
-
100
-
101
-
102
-
103
-
104
-
105
-
106
-
107
-
108
-
109
-
110
-
111
-
112
-
113
-
114
-
115
-
116
-
117
-
118
-
119
-
120
-
121
-
122
-
123
-
124
-
125
-
126
-
127
-
128
-
129
-
130
-
131
-
132
-
133
-
134
-
135
-
136
-
137
-
138
-
139
-
140
-
141
-
142
-
143
-
144
-
145
-
146
-
147
-
148
-
149
-
150
-
151
-
152
-
153
-
154
-
155
-
156
-
157
-
158
-
159
-
160
-
161
-
162
-
163
-
164
-
165
-
166
-
167
-
168
-
169
-
170
-
171
-
172
-
173
-
174
-
175
-
176
-
177
-
178
-
179
-
180
-
181
-
182
-
183
-
184
-
185
-
186
 |
 |

60
Excluding the goodwill impairment charge, non-interest expense declined by 18.5% over the period, as volume related pullbacks
resulted in lower origination and servicing costs, coupled with an overall improvement in efficiency over the period.
Year Ended December 31, 2007 Compared to Year Ended December 31, 2006
The Auto Finance sub-segment recognized a net loss of $33.8 million during 2007, compared with net income of $233.5 million
during 2006, as revenue generated from portfolio growth was more than offset by worsening credit performance.
The loan portfolio increased 16% year over year as a result of the transfer of $1.8 billion of North Fork Banks auto loans to the Auto
Finance sub-segment on January 1, 2007 and strong organic originations growth within our dealer and direct marketing channels.
Originations in 2007 were $13.2 billion, 7% higher than prior year. As a result of this portfolio growth, net interest income increased
10% during 2007 compared to 2006.
Non-interest income for 2007 included a one-time gain of $46.2 million related to the sale of 1.8 million shares of DealerTrack.
During 2007, the Auto Finance sub-segments net charge-off rate was 3.06%, up 78 basis points from 2.28% during 2006. Net charge-
offs of loans outstanding increased $272.8 million, or 58%, while average loans outstanding during 2007 grew $3.7 billion, or 18%,
compared to 2006. The 30-plus day delinquency rate was up 149 basis points at December 31, 2007. The adverse credit performance
was mainly driven by credit normalization following the unusually favorable credit environment in 2006 and elevated losses with
weakening U.S. economy. The provision for loan and lease losses increased $561.3 million, or 113% during 2007. This increase was
driven by a weakening U.S. economy, growth in the loan portfolio, and elevated losses from discontinued programs in our prime
segment, as well as moderately worse credit quality in subprime.
In 2007, Non-interest expense increased 3%, compared to 12% revenue growth. Operating costs as a percent of loans have declined
from 2.8% during the first quarter of 2007 to 2.3% during the fourth quarter of 2007 as the Auto Finance sub-segment realized the
benefits of the integration of the dealer programs of the legacy Capital One, Onyx, Hibernia, and North Fork auto lending businesses.
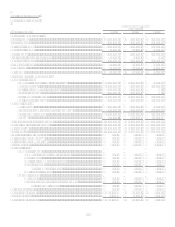
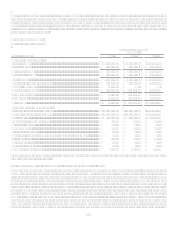
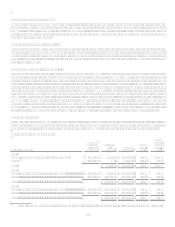
International (a sub-segment of Other National Lending)
Table 7: International
As of and for the Year Ended
December 31,
(Dollars in thousands)
2008
2007
2006
Earnings (Managed Basis)
Interest income...................................................................................................
.
$ 1,466,737 $ 1,630,041 $ 1,520,213
Interest expense..................................................................................................
.
495,343 571,593 536,096
Net interest income.............................................................................................
.
971,394 1,058,448 984,117
Non-interest income ...........................................................................................
.
550,762 622,308 592,977
Total revenue......................................................................................................
.
1,522,156 1,680,756 1,577,094
Provision for loan and lease losses.....................................................................
.
646,975 602,350 696,335
Non-interest expense..........................................................................................
.
771,317 867,062 828,331
Income before taxes ...........................................................................................
.
103,864 211,344 52,428
Income taxes.......................................................................................................
.
35,998 71,441 21,579
Net income .........................................................................................................
.
$ 67,866 $ 139,903 $ 30,849
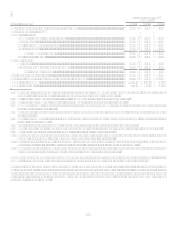
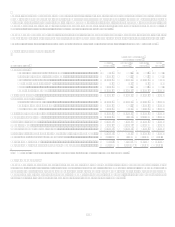
Selected Metrics (Managed Basis)
Period end loans held for investment .................................................................
.
$ 8,720,642 $ 11,656,922 $ 11,750,819
Average loans held for investment.....................................................................
.
$ 10,570,791 $ 11,310,239 $ 11,131,001
Loans held for investment yield .........................................................................
.
13.88% 14.41% 13.66%
Net interest margin .............................................................................................
.
9.19% 9.36% 8.84%
Revenue margin..................................................................................................
.
14.40% 14.86% 14.17%
Risk-adjusted margin..........................................................................................
.
8.63% 9.24% 8.43%
Non-interest expense as a % of average loans held for investment....................
.
7.30% 7.67% 7.44%
Efficiency ratio...................................................................................................
.
50.67% 51.59% 52.52%
Net charge-off rate .............................................................................................
.
5.77% 5.63% 5.73%
30+ day delinquency rate ...................................................................................
.
5.51% 4.79% 4.55%
Purchase volume ................................................................................................
.
$ 10,800,227 $ 9,305,307 $ 7,892,897
Number of total accounts (000s) ........................................................................
.
5,747 5,722 5,610