Capital One 2008 Annual Report Download - page 91
Download and view the complete annual report
Please find page 91 of the 2008 Capital One annual report below. You can navigate through the pages in the report by either clicking on the pages listed below, or by using the keyword search tool below to find specific information within the annual report.-
 1
1 -
2
-
3
-
4
-
5
-
6
-
7
-
8
-
9
-
10
-
11
-
12
-
13
-
14
-
15
-
16
-
17
-
18
-
19
-
20
-
21
-
22
-
23
-
24
-
25
-
26
-
27
-
28
-
29
-
30
-
31
-
32
-
33
-
34
-
35
-
36
-
37
-
38
-
39
-
40
-
41
-
42
-
43
-
44
-
45
-
46
-
47
-
48
-
49
-
50
-
51
-
52
-
53
-
54
-
55
-
56
-
57
-
58
-
59
-
60
-
61
-
62
-
63
-
64
-
65
-
66
-
67
-
68
-
69
-
70
-
71
-
72
-
73
-
74
-
75
-
76
-
77
-
78
-
79
-
80
-
 81
81 -
 82
82 -
 83
83 -
 84
84 -
 85
85 -
 86
86 -
 87
87 -
 88
88 -
 89
89 -
 90
90 -
 91
91 -
 92
92 -
 93
93 -
 94
94 -
 95
95 -
 96
96 -
 97
97 -
 98
98 -
 99
99 -
 100
100 -
 101
101 -
102
-
103
-
104
-
105
-
106
-
107
-
108
-
109
-
110
-
111
-
112
-
113
-
114
-
115
-
116
-
117
-
118
-
119
-
120
-
121
-
122
-
123
-
124
-
125
-
126
-
127
-
128
-
129
-
130
-
131
-
132
-
133
-
134
-
135
-
136
-
137
-
138
-
139
-
140
-
141
-
142
-
143
-
144
-
145
-
146
-
147
-
148
-
149
-
150
-
151
-
152
-
153
-
154
-
155
-
156
-
157
-
158
-
159
-
160
-
161
-
162
-
163
-
164
-
165
-
166
-
167
-
168
-
169
-
170
-
171
-
172
-
173
-
174
-
175
-
176
-
177
-
178
-
179
-
180
-
181
-
182
-
183
-
184
-
185
-
186
 |
 |

73
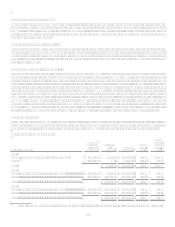
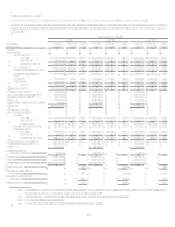
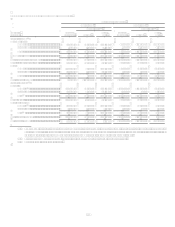
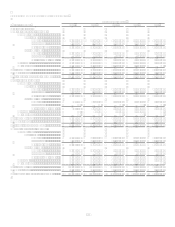
XI. Tabular Summary
TABLE ASTATEMENTS OF AVERAGE BALANCES, INCOME AND EXPENSE, YIELDS AND RATES
Table A provides average balance sheet data and an analysis of net interest income, net interest spread (the difference between the
yield on earning assets and the cost of interest-bearing liabilities) and net interest margin for the years ended December 31, 2008, 2007
and 2006.
Year Ended December 31
2008
2007(2)
2006(2)
(Dollars in
Thousands)
Average
Balance
Income/
Expense
Yield/
Rate
Average
Balance
Income/
Expense
Yield/
Rate
Average
Balance
Income/
Expense
Yield/
Rate
Assets:
Earning assets
Consumer loans(1)
Domestic $ 57,778,303 $ 6,531,101 11.30% $ 56,565,058 $ 6,601,387 11.67% $ 47,427,119 $ 5,986,533 12.62 %
International 3,442,045 444,691 12.92% 3,471,453 436,368 12.57% 3,842,113 433,126 11.27 %
Total consumer loans 61,220,348 6,975,792 11.39% 60,036,511 7,037,755 11.72% 51,269,232 6,419,659 12.52 %
Commercial loans 37,750,555 2,484,586 6.58% 33,505,314 2,462,373 7.35% 12,308,047 626,814 5.09 %
Total loans held for investment(4) 98,970,903 9,460,378 9.56% 93,541,825 9,500,128 10.16% 63,577,279 7,046,473 11.08 %
Securities available for sale 25,042,506 1,224,012 4.89% 18,933,750 950,972 5.02% 14,686,556 676,712 4.61 %
Other
Domestic(3) 8,030,295 406,240 5.06% 7,792,357 573,158 7.36% 4,716,374 391,351 8.30 %
International 1,039,940 21,369 2.05% 1,152,497 53,898 4.68% 1,106,527 50,199 4.54 %
Total(3) 9,070,235 427,609 4.71% 8,944,854 627,056 7.01% 5,822,901 441,550 7.58 %
Total earning assets(3) $ 133,083,644 $ 11,111,999 8.35% 121,420,429 $ 11,078,156 9.12% 84,086,736 $ 8,164,735 9.71 %
Cash and due from banks(3) 2,127,961 2,112,587 1,680,104
Allowance for loan and lease losses(3) (3,266,768) (2,182,667) (1,791,172 )
Premises and equipment, net(3) 2,317,383 2,250,117 1,469,807
Other(3) 21,964,147 21,398,626 9,809,231
Total assets from discontinued operations 65,161 3,984,100 555,053
Total assets $ 156,291,528 $ 148,983,192 $ 95,809,759
Liabilities and Equity:
Interest-bearing liabilities
Deposits
Domestic $ 79,293,788 $ 2,422,532 3.06% $ 71,447,121 $ 2,781,662 3.89% $ 43,262,771 $ 1,700,986 3.93 %
International 3,441,839 89,508 2.60% 2,317,790 124,689 5.38% 2,329,611 113,811 4.89 %
Total deposits 82,735,627 2,512,040 3.04% 73,764,911 2,906,351 3.94% 45,592,382 1,814,797 3.98 %
Senior and subordinated notes 8,881,491 444,854 5.01% 9,840,074 577,128 5.87% 6,820,615 411,643 6.04 %
Other borrowings
Domestic 21,399,280 993,901 4.64% 19,171,300 1,050,546 5.48% 16,515,126 836,667 5.07 %
International 815,706 12,489 1.53% 1,090,149 14,286 1.31% 1,115,981 10,182 0.91 %
Total other borrowings 22,214,986 1,006,390 4.53% 20,261,449 1,064,832 5.26% 17,631,107 846,849 4.80 %
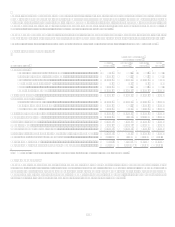
Total interest-bearing liabilities(3) 113,832,104 $ 3,963,284 3.48% 103,866,434 $ 4,548,311 4.38% 70,044,104 $ 3,073,289 4.39 %
Non-interest bearing deposits(3) 10,772,019
11,446,706 4,934,407
Other(3) 6,261,090
5,349,568
4,169,298
Total liabilities from
discontinued operations .......................... 148,485 3,117,348
458,528
Total liabilities .............................................. 131,013,698 123,780,056
79,606,337
Equity ............................................................ 25,277,830 25,203,136
16,203,422
Total liabilities and equity ............................ $ 156,291,528 $ 148,983,192 $ 95,809,759
Net interest spread ........................................ 4.87% 4.74 %
5.32 %
Interest income to average
earning assets .......................................... 8.35% 9.12 %
9.71 %
Interest expense to average
earning assets .......................................... 2.97% 3.74 %
3.65 %
Net interest margin........................................ 5.38% 5.38 %
6.06 %
(1) Interest income includes past-due fees on loans of approximately $695.2 million, $704.5 million and $699.5 million for
the years ended December 31, 2008, 2007 and 2006, respectively.
(2) Prior period amounts have been reclassified to conform with current period presentation.
(3) Based on continuing operations.
(4) Non-accrual loans are included in their respective loan categories.