Capital One 2008 Annual Report Download - page 75
Download and view the complete annual report
Please find page 75 of the 2008 Capital One annual report below. You can navigate through the pages in the report by either clicking on the pages listed below, or by using the keyword search tool below to find specific information within the annual report.-
 1
1 -
2
-
3
-
4
-
5
-
6
-
7
-
8
-
9
-
10
-
11
-
12
-
13
-
14
-
15
-
16
-
17
-
18
-
19
-
20
-
21
-
22
-
23
-
24
-
25
-
26
-
27
-
28
-
29
-
30
-
31
-
32
-
33
-
34
-
35
-
36
-
37
-
38
-
39
-
40
-
41
-
42
-
43
-
44
-
45
-
46
-
47
-
48
-
49
-
50
-
51
-
52
-
53
-
54
-
55
-
56
-
57
-
58
-
59
-
60
-
61
-
62
-
63
-
64
-
 65
65 -
 66
66 -
 67
67 -
 68
68 -
 69
69 -
 70
70 -
 71
71 -
 72
72 -
 73
73 -
 74
74 -
 75
75 -
 76
76 -
 77
77 -
 78
78 -
 79
79 -
 80
80 -
 81
81 -
 82
82 -
 83
83 -
 84
84 -
 85
85 -
86
-
87
-
88
-
89
-
90
-
91
-
92
-
93
-
94
-
95
-
96
-
97
-
98
-
99
-
100
-
101
-
102
-
103
-
104
-
105
-
106
-
107
-
108
-
109
-
110
-
111
-
112
-
113
-
114
-
115
-
116
-
117
-
118
-
119
-
120
-
121
-
122
-
123
-
124
-
125
-
126
-
127
-
128
-
129
-
130
-
131
-
132
-
133
-
134
-
135
-
136
-
137
-
138
-
139
-
140
-
141
-
142
-
143
-
144
-
145
-
146
-
147
-
148
-
149
-
150
-
151
-
152
-
153
-
154
-
155
-
156
-
157
-
158
-
159
-
160
-
161
-
162
-
163
-
164
-
165
-
166
-
167
-
168
-
169
-
170
-
171
-
172
-
173
-
174
-
175
-
176
-
177
-
178
-
179
-
180
-
181
-
182
-
183
-
184
-
185
-
186
 |
 |
57
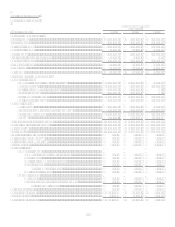
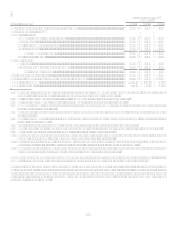
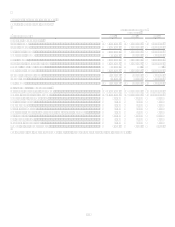
Year Ended December 31, 2008 Compared to Year Ended December 31, 2007
Period end loans outstanding increased $1.2 billion, or 2%, with modest growth in our credit card business being partially offset by
pullbacks in closed-end loans. Purchase volume decreased by 3% year over year, particularly in the fourth quarter, as purchases did
not show seasonal growth, actually declining from the third quarter. Lower payments have offset the decreased purchase volume, with
a decline of 4% from 2007 to 2008. Accounts have declined by 3.7 million primarily in the U.S. Card sub-segment as the Company
closed approximately 2 million inactive accounts during the second quarter of 2008.
The U.S. Card sub-segment had earnings of $1.0 billion in 2008, a decline of 56% year over year, driven by higher losses and
allowance builds on worsening credit, partially offset by slightly increased revenue and lower non-interest expenses. The slight
increase in revenue was due to lower interest expenses, while the decrease in non-interest expense was due to benefits from the
Companys cost reduction initiatives.
Total revenues increased by 2% over the prior year, with slight increases in both interest and non-interest income. Net interest margin
increased 7 basis points to 9.46%, which combined with increases in loans held for investment accounted for the bulk of the higher
revenues.
The provision for loan and lease losses increased 80% to $5.5 billion during 2008, driven entirely by a significantly worse credit
environment. Net adjusted charge-offs increased $1.7 billion, or 63%, during the year to $4.3 billion. The allowance for loan and lease
losses increased $751.1 million, or 207%. The net charge-off rate increased 233 basis points over 2007 for a full-year rate of 6.33%,
while the 30+ day delinquency rate increased 50 basis points to end the year at 4.78%.
Total non-interest expenses decreased 8% from 2007 to $3.6 billion. Marketing expenses declined as a result of risk-related pullbacks
and improved marketing efficiency. Operating expenses declined as a result of continued focus on efficiency gains.
Year Ended December 31, 2007 Compared to Year Ended December 31, 2006
The U.S. Card sub-segment had earnings of $2.3 billion, an increase of 11% year-over-year due to higher revenue generation and
increased operational efficiency, partially offset by the worsening credit environment and associated allowance build.
Period end loans outstanding increased $1.0 billion, or 1%, during 2007, mainly due to heavy growth within installment loans and
small business products, partially offset by a portfolio sale related to the exit of a co-branded consumer card partnership at the end of
the first quarter of 2007. Purchase volume increased $3.8 billion, or 4%, with increases in both consumer card, 3%, and small
business, 7%.
Total revenues increased by $1.2 billion, or 13%, over the prior year, as margins expanded due to product and marketing strategy
changes implemented in 2007. Net interest margin increased 70 bps to 9.39%, while revenue margin increased 110 bps to 15.59%,
primarily due to selective pricing and fee changes within consumer card.
The provision for loan and lease losses increased 50% to $3.0 billion during 2007. The increase is partly driven by the normalization
of credit in 2007 following the unusually favorable credit environment in 2006, in addition to general economic weakening. Net
adjusted charge-offs increased $681 million, or 34%, and the allowance for loan and lease losses increased $334 million as all
businesses experienced worsenings.
Non-interest expenses for 2007 decreased $166 million, or 4%, due to lower marketing spend as a result of evolving marketing
strategy, and slightly lower operating expenses from increased operational efficiency.