Capital One 2008 Annual Report Download - page 47
Download and view the complete annual report
Please find page 47 of the 2008 Capital One annual report below. You can navigate through the pages in the report by either clicking on the pages listed below, or by using the keyword search tool below to find specific information within the annual report.-
 1
1 -
2
-
3
-
4
-
5
-
6
-
7
-
8
-
9
-
10
-
11
-
12
-
13
-
14
-
15
-
16
-
17
-
18
-
19
-
20
-
21
-
22
-
23
-
24
-
25
-
26
-
27
-
28
-
29
-
30
-
31
-
32
-
33
-
34
-
35
-
36
-
 37
37 -
 38
38 -
 39
39 -
 40
40 -
 41
41 -
 42
42 -
 43
43 -
 44
44 -
 45
45 -
 46
46 -
 47
47 -
 48
48 -
 49
49 -
 50
50 -
 51
51 -
 52
52 -
 53
53 -
 54
54 -
 55
55 -
 56
56 -
 57
57 -
58
-
59
-
60
-
61
-
62
-
63
-
64
-
65
-
66
-
67
-
68
-
69
-
70
-
71
-
72
-
73
-
74
-
75
-
76
-
77
-
78
-
79
-
80
-
81
-
82
-
83
-
84
-
85
-
86
-
87
-
88
-
89
-
90
-
91
-
92
-
93
-
94
-
95
-
96
-
97
-
98
-
99
-
100
-
101
-
102
-
103
-
104
-
105
-
106
-
107
-
108
-
109
-
110
-
111
-
112
-
113
-
114
-
115
-
116
-
117
-
118
-
119
-
120
-
121
-
122
-
123
-
124
-
125
-
126
-
127
-
128
-
129
-
130
-
131
-
132
-
133
-
134
-
135
-
136
-
137
-
138
-
139
-
140
-
141
-
142
-
143
-
144
-
145
-
146
-
147
-
148
-
149
-
150
-
151
-
152
-
153
-
154
-
155
-
156
-
157
-
158
-
159
-
160
-
161
-
162
-
163
-
164
-
165
-
166
-
167
-
168
-
169
-
170
-
171
-
172
-
173
-
174
-
175
-
176
-
177
-
178
-
179
-
180
-
181
-
182
-
183
-
184
-
185
-
186
 |
 |

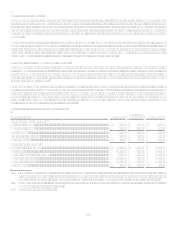
29
(Dollars in millions, Except Per Share Data)
2008
2007 (1)
2006(1)(5)
2005(1)(4)
2004 (1)
Five Year
Compound
Growth Rate
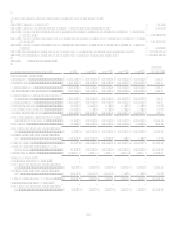
Managed Metrics(3):
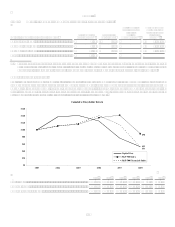
Revenue margin ................................
.
9.39% 9.85% 10.66% 12.45% 12.89% (6.14)%
Net interest margin............................
.
6.37 6.46 6.88 7.80 7.88 (4.16)%
Risk adjusted margin.........................
.
5.81 7.40 8.23 8.76 9.03 (8.45)%
Delinquency rate...............................
.
4.49 3.87 3.02 3.24 3.82 3.28%
Net charge-off rate ............................
.
4.35 2.88 2.84 4.25 4.41 (0.27)%
Return on average assets...................
.
0.04 1.33 1.70 1.72 1.73 (30.24)%
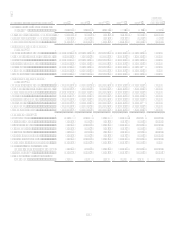
Non-interest expense as a % of
average loans held for
investment(7)..................................
.
5.01 5.58 6.24 6.71 7.22 (7.06)%
Efficiency ratio (7) ..............................
.
43.14 47.30 50.17 46.81 49.01 (2.52)%
Average loans held for investment....
.
$ 147,812.3 $ 144,727.0 $ 111,328.6 $ 85,265.0 $ 73,711.7 14.93%
Average earning assets......................
.
$ 179,348.1 $ 170,496.1 $ 129,812.8 $ 98,097.2 $ 84,240.3 16.31%
Year-end loans held for investment ..
.
$ 146,936.8 $ 151,362.4 $ 146,151.3 $ 105,527.5 $ 79,861.3 12.97%
Year-end total loan accounts.............
.
45.4 49.1 50.0 49.7 48.6 0.63%
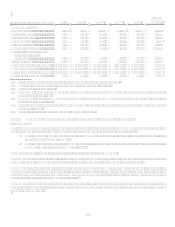
(1) Prior period amounts have been reclassified to conform with current period presentation.
(2) Non-interest bearing deposits for the year 2004 were included in other liabilities.
(3) Based on continuing operations.
(4) On November 16, 2005, the Company acquired 100% of the outstanding common stock of Hibernia Corporation for total
consideration of $5.0 billion.
(5) On December 1, 2006, the Company acquired 100% of the outstanding common stock of North Fork Bancorporation for total
consideration of $13.2 billion.
(6) Discontinued operations related to the shutdown of mortgage origination operations of GreenPoints wholesale mortgage
banking unit in 2007.
(7) Excludes restructuring expenses and goodwill impairment charges.
Item 7. Managements Discussion and Analysis of Financial Condition and Results of Operations
I. Introduction
Capital One Financial Corporation (the Corporation) is a diversified financial services company whose banking and non-banking
subsidiaries market a variety of financial products and services. The Corporations principal subsidiaries are:
Capital One Bank, (USA), National Association (COBNA) which currently offers credit and debit card products, other
lending products and deposit products.
Capital One, National Association (CONA) which offers a broad spectrum of banking products and financial services to
consumers, small businesses and commercial clients.
The Corporation and its subsidiaries are hereafter collectively referred to as the Company.
The Company continues to deliver on its strategy of combining the power of national scale lending and local scale banking. As of
December 31, 2008, the Company had $108.6 billion in deposits and $146.9 billion in managed loans outstanding.
The Companys earnings are primarily driven by lending to consumers and commercial customers and by deposit-taking activities
which generate net interest income, and by activities that generate non-interest income, including the sale and servicing of loans and
providing fee-based services to customers. Customer usage and payment patterns, credit quality, levels of marketing expense and
operating efficiency all affect the Companys profitability.
The Companys primary expenses are the costs of funding assets, provision for loan and lease losses, operating expenses (including
associate salaries and benefits, infrastructure maintenance and enhancements, and branch operations and expansion costs), marketing
expenses, and income taxes.