Capital One 2008 Annual Report Download - page 143
Download and view the complete annual report
Please find page 143 of the 2008 Capital One annual report below. You can navigate through the pages in the report by either clicking on the pages listed below, or by using the keyword search tool below to find specific information within the annual report.-
 1
1 -
2
-
3
-
4
-
5
-
6
-
7
-
8
-
9
-
10
-
11
-
12
-
13
-
14
-
15
-
16
-
17
-
18
-
19
-
20
-
21
-
22
-
23
-
24
-
25
-
26
-
27
-
28
-
29
-
30
-
31
-
32
-
33
-
34
-
35
-
36
-
37
-
38
-
39
-
40
-
41
-
42
-
43
-
44
-
45
-
46
-
47
-
48
-
49
-
50
-
51
-
52
-
53
-
54
-
55
-
56
-
57
-
58
-
59
-
60
-
61
-
62
-
63
-
64
-
65
-
66
-
67
-
68
-
69
-
70
-
71
-
72
-
73
-
74
-
75
-
76
-
77
-
78
-
79
-
80
-
81
-
82
-
83
-
84
-
85
-
86
-
87
-
88
-
89
-
90
-
91
-
92
-
93
-
94
-
95
-
96
-
97
-
98
-
99
-
100
-
101
-
102
-
103
-
104
-
105
-
106
-
107
-
108
-
109
-
110
-
111
-
112
-
113
-
114
-
115
-
116
-
117
-
118
-
119
-
120
-
121
-
122
-
123
-
124
-
125
-
126
-
127
-
128
-
129
-
130
-
131
-
132
-
 133
133 -
 134
134 -
 135
135 -
 136
136 -
 137
137 -
 138
138 -
 139
139 -
 140
140 -
 141
141 -
 142
142 -
 143
143 -
 144
144 -
 145
145 -
 146
146 -
 147
147 -
 148
148 -
 149
149 -
 150
150 -
 151
151 -
 152
152 -
 153
153 -
154
-
155
-
156
-
157
-
158
-
159
-
160
-
161
-
162
-
163
-
164
-
165
-
166
-
167
-
168
-
169
-
170
-
171
-
172
-
173
-
174
-
175
-
176
-
177
-
178
-
179
-
180
-
181
-
182
-
183
-
184
-
185
-
186
 |
 |

125
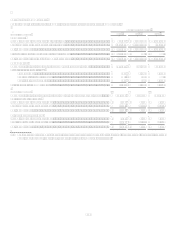
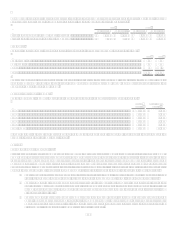
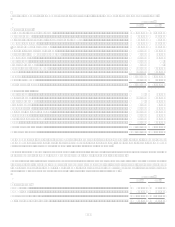
Assumed health care cost trend rates have a significant effect on the amounts reported for the other postretirement benefit plans. A
one-percentage point change in assumed health care cost trend rates would have the following effects:
2008
2007
1% Increase
1% Decrease
1% Increase
1% Decrease
Effect on year-end postretirement benefit obligation................................ $ 7,752 $ (6,533) $ 5,684 $ (4,817)
Effect on total service and interest cost components ................................ $ 698 $ (579) $ 1,780 $ (1,459)
Plan Assets
The qualified defined benefit pension plan asset allocations as of the annual measurement dates are as follows:
2008
2007
Equity securities..........................................................................................................................................................
.
65% 70%
Debt securities.............................................................................................................................................................
.
34% 30%
Other ...........................................................................................................................................................................
.
1%
Total............................................................................................................................................................................
.
100% 100%
The investment guidelines provide the following asset allocation targets and ranges: domestic equity target of 50% and allowable
range of 45% to 55%, international equity target of 20% and allowable range of 15% to 25%, and domestic debt securities target of
30% and allowable range of 25% to 40%.
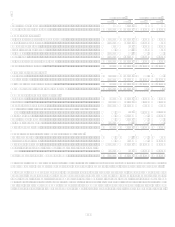
Expected future benefit payments
The following benefit payments, which reflect expected future service, as appropriate, are expected to be paid:
Pension
Benefits
Postretirement
Benefits
2009 .............................................................................................................................................................
.
$ 16,169 $ 3,497
2010 .............................................................................................................................................................
.
15,037 3,824
2011 .............................................................................................................................................................
.
15,225 4,182
2012 .............................................................................................................................................................
.
15,399 4,367
2013 .............................................................................................................................................................
.
14,377 4,853
2014 - 2018 ..................................................................................................................................................
.
68,878 29,610
In 2009, $0.9 million in contributions are expected to be made to the pension plans, and $3.5 million in contributions are expected to
be made to the other postretirement benefit plans.
Note 12
Fair Value of Assets and Liabilities
Effective January 1, 2008, the Company adopted SFAS 157, which provides a framework for measuring fair value under GAAP.
SFAS 157 defines fair value as the exchange price that would be received for an asset or paid to transfer a liability (an exit price) in
the principal or most advantageous market for the asset or liability in an orderly transaction between market participants on the
measurement date. SFAS 157 requires that valuation techniques maximize the use of observable inputs and minimize the use of
unobservable inputs. SFAS 157 also establishes a fair value hierarchy which prioritizes the valuation inputs into three broad levels.
Based on the underlying inputs, each fair value measurement in its entirety is reported in one of the three levels. These levels are:
Level 1 Valuation is based upon quoted prices for identical instruments traded in active markets. Level 1 assets and
liabilities include debt and equity securities traded in an active exchange market, as well as U.S. Treasury securities.
Level 2 Valuation is based upon quoted prices for similar instruments in active markets, quoted prices for identical or
similar instruments in markets that are not active, and model based valuation techniques for which all significant
assumptions are observable in the market or can be corroborated by observable market data for substantially the full term
of the assets or liabilities.
Level 3 Valuation is determined using model-based techniques with significant assumptions not observable in the
market. These unobservable assumptions reflect the Companys own estimates of assumptions that market participants
would use in pricing the asset or liability. Valuation techniques include the use of third party pricing services, option
pricing models, discounted cash flow models and similar techniques.