Capital One 2008 Annual Report Download - page 77
Download and view the complete annual report
Please find page 77 of the 2008 Capital One annual report below. You can navigate through the pages in the report by either clicking on the pages listed below, or by using the keyword search tool below to find specific information within the annual report.-
 1
1 -
2
-
3
-
4
-
5
-
6
-
7
-
8
-
9
-
10
-
11
-
12
-
13
-
14
-
15
-
16
-
17
-
18
-
19
-
20
-
21
-
22
-
23
-
24
-
25
-
26
-
27
-
28
-
29
-
30
-
31
-
32
-
33
-
34
-
35
-
36
-
37
-
38
-
39
-
40
-
41
-
42
-
43
-
44
-
45
-
46
-
47
-
48
-
49
-
50
-
51
-
52
-
53
-
54
-
55
-
56
-
57
-
58
-
59
-
60
-
61
-
62
-
63
-
64
-
65
-
66
-
 67
67 -
 68
68 -
 69
69 -
 70
70 -
 71
71 -
 72
72 -
 73
73 -
 74
74 -
 75
75 -
 76
76 -
 77
77 -
 78
78 -
 79
79 -
 80
80 -
 81
81 -
 82
82 -
 83
83 -
 84
84 -
 85
85 -
 86
86 -
 87
87 -
88
-
89
-
90
-
91
-
92
-
93
-
94
-
95
-
96
-
97
-
98
-
99
-
100
-
101
-
102
-
103
-
104
-
105
-
106
-
107
-
108
-
109
-
110
-
111
-
112
-
113
-
114
-
115
-
116
-
117
-
118
-
119
-
120
-
121
-
122
-
123
-
124
-
125
-
126
-
127
-
128
-
129
-
130
-
131
-
132
-
133
-
134
-
135
-
136
-
137
-
138
-
139
-
140
-
141
-
142
-
143
-
144
-
145
-
146
-
147
-
148
-
149
-
150
-
151
-
152
-
153
-
154
-
155
-
156
-
157
-
158
-
159
-
160
-
161
-
162
-
163
-
164
-
165
-
166
-
167
-
168
-
169
-
170
-
171
-
172
-
173
-
174
-
175
-
176
-
177
-
178
-
179
-
180
-
181
-
182
-
183
-
184
-
185
-
186
 |
 |

59
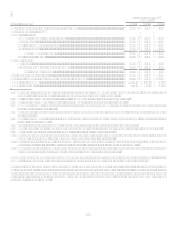
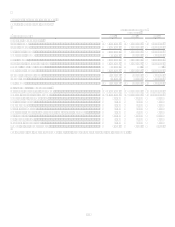
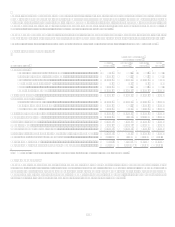
Auto Finance (a sub-segment of Other National Lending)
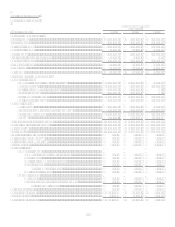
Table 6: Auto Finance
As of and for the Year Ended
December 31,
(Dollars in thousands)
2008
2007
2006
Earnings (Managed Basis)
Interest income................................................................................................... $ 2,614,967 $ 2,638,290 $ 2,237,205
Interest expense.................................................................................................. 1,087,573 1,127,421 864,688
Net interest income ............................................................................................ 1,527,394 1,510,869 1,372,517
Non-interest income........................................................................................... 59,235 112,261 81,384
Total revenue ..................................................................................................... 1,586,629 1,623,130 1,453,901
Provision for loan and lease losses .................................................................... 1,320,515 1,056,120 494,835
Goodwill impairment charge ............................................................................. 810,876
Non-interest expense.......................................................................................... 503,942 618,568 599,807
Income before taxes ........................................................................................... (1,048,704) (51,558) 359,259
Income taxes ...................................................................................................... (89,759) (17,736) 125,740
Net income (loss)............................................................................................... $ (958,945) $ (33,822) $ 233,519
Selected Metrics (Managed Basis)
Period end loans held for investment................................................................. $ 21,481,911 $ 25,128,352 $ 21,751,827
Average loans held for investment..................................................................... $ 23,483,706 $ 24,150,231 $ 20,490,920
Loans held for investment yield......................................................................... 11.14% 10.92% 10.92%
Net interest margin............................................................................................. 6.50% 6.26% 6.70%
Revenue margin ................................................................................................. 6.76% 6.72% 7.10%
Risk adjusted margin.......................................................................................... 2.17% 3.66% 4.82%
Non-interest expense as a % of average loans held for investment ................... 2.15% 2.56% 2.93%
Efficiency ratio .................................................................................................. 31.76% 38.11% 41.25%
Net charge-off rate ............................................................................................. 4.59% 3.06% 2.28%
30+ day delinquency rate................................................................................... 9.91% 7.84% 6.36%
Auto loan originations........................................................................................ $ 6,874,340
$ 13,176,533 $ 12,285,306
Number of total accounts (000s)........................................................................ 1,634 1,771 1,589
The Auto Finance sub-segment consists of automobile and other motor vehicle financing activities.
Year Ended December 31, 2008 Compared to Year Ended December 31, 2007
The Auto Finance sub-segment recognized a net loss of $958.9 million during 2008, compared with a net loss of $33.8 million during
2007. Excluding the $804.4 million after tax impact of the goodwill impairment incurred in the fourth quarter of 2008, the Auto
Finance sub-segment recognized a net loss of $154.5 million in 2008, driven primarily by higher credit related expenses due to the
worsening economy and the general conditions surrounding the auto industry over the past year.
As a result of the uncertain operating environment, the Auto Finance sub-segment chose to purposefully reduce the size of the loan
portfolio from the prior period. Originations in 2008 were $6.9 billion, 48% lower than the prior year, driven by pullbacks across both
the dealer and direct channels. Loans held for investment decreased 15% year over year, as the business focused on its most resilient
customer segments during these economic challenges.
Despite the significant volume pullbacks over the period, total revenue in 2008 declined only 2% from 2007. Partially offsetting the
volume driven revenue impacts was an ability to modestly increase net interest margin as several key competitors pulled back or
exited markets over the period.
During 2008, the Auto Finance sub-segments net charge-off rate was 4.59%, up 153 basis points from 3.06% during 2007. Net
charge-offs increased $340.4 million, or 46%, while average loans outstanding during 2008 decreased $666.5 million, or 3%,
compared to 2007. Declining auction rates for used vehicles contributed approximately $31.1 million to the increase in net charge-
offs. The 30-plus day delinquency rate was 9.91%, up 207 basis points at December 31, 2008 versus prior year. The provision for loan
losses increased $264.4 million, or 25% in 2008 driven by further weakening in the U.S. economy, partially offset by the shrinking
loan portfolio over the period.