Capital One 2008 Annual Report Download - page 103
Download and view the complete annual report
Please find page 103 of the 2008 Capital One annual report below. You can navigate through the pages in the report by either clicking on the pages listed below, or by using the keyword search tool below to find specific information within the annual report.-
 1
1 -
2
-
3
-
4
-
5
-
6
-
7
-
8
-
9
-
10
-
11
-
12
-
13
-
14
-
15
-
16
-
17
-
18
-
19
-
20
-
21
-
22
-
23
-
24
-
25
-
26
-
27
-
28
-
29
-
30
-
31
-
32
-
33
-
34
-
35
-
36
-
37
-
38
-
39
-
40
-
41
-
42
-
43
-
44
-
45
-
46
-
47
-
48
-
49
-
50
-
51
-
52
-
53
-
54
-
55
-
56
-
57
-
58
-
59
-
60
-
61
-
62
-
63
-
64
-
65
-
66
-
67
-
68
-
69
-
70
-
71
-
72
-
73
-
74
-
75
-
76
-
77
-
78
-
79
-
80
-
81
-
82
-
83
-
84
-
85
-
86
-
87
-
88
-
89
-
90
-
91
-
92
-
 93
93 -
 94
94 -
 95
95 -
 96
96 -
 97
97 -
 98
98 -
 99
99 -
 100
100 -
 101
101 -
 102
102 -
 103
103 -
 104
104 -
 105
105 -
 106
106 -
 107
107 -
 108
108 -
 109
109 -
 110
110 -
 111
111 -
 112
112 -
 113
113 -
114
-
115
-
116
-
117
-
118
-
119
-
120
-
121
-
122
-
123
-
124
-
125
-
126
-
127
-
128
-
129
-
130
-
131
-
132
-
133
-
134
-
135
-
136
-
137
-
138
-
139
-
140
-
141
-
142
-
143
-
144
-
145
-
146
-
147
-
148
-
149
-
150
-
151
-
152
-
153
-
154
-
155
-
156
-
157
-
158
-
159
-
160
-
161
-
162
-
163
-
164
-
165
-
166
-
167
-
168
-
169
-
170
-
171
-
172
-
173
-
174
-
175
-
176
-
177
-
178
-
179
-
180
-
181
-
182
-
183
-
184
-
185
-
186
 |
 |

85
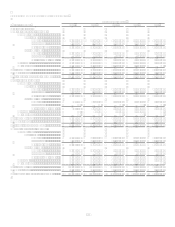
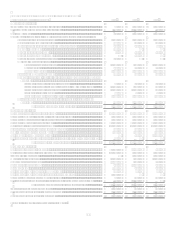
CONSOLIDATED STATEMENTS OF CASH FLOWS
Year Ended December 31 (In Thousands) 2008
2007
2006
Operating Activities:
Income from continuing operations, net of tax............................................................ $ 84,517
$ 2,591,719 $ 2,426,377
Loss from discontinued operations, net of tax............................................................. (130,515) (1,021,387) (11,884)
Net income (loss) ........................................................................................................ (45,998) 1,570,332 2,414,493
Adjustments to reconcile net income to cash provided by operating activities:
Provision for loan and lease losses.................................................................... 5,101,040
2,636,502 1,476,438
Depreciation and amortization, net.................................................................... 691,430
678,757 542,090
(Gains) losses on sales of securities available for sale ...................................... (12,791) (69,976) 29,203
Goodwill impairment ........................................................................................ 810,876
Gains on sales of auto loans .............................................................................. (2,428) (10,960) (28,609)
Gains on extinguishment of debt.......................................................................
(17,444)
Gains on repurchase of senior notes.................................................................. (53,860)
Mortgage loans held for sale: ............................................................................
Transfers in and originations................................................................... (1,949,263) (404,831) (4,625,378)
Gains on sales.......................................................................................... (31,016) (87,521) (77,285)
Proceeds from sales................................................................................. 2,211,225
6,171,912 3,060,657
Stock plan compensation expense ..................................................................... 111,646
338,778 211,117
Changes in assets and liabilities, net of effects from purchase of companies
acquired:.......................................................................................................
(Increase) decrease in interest receivable ................................................ 11,408
(35,017) (45,311)
(Increase) decrease in accounts receivable from securitizations ............. (1,624,875) (130,439) 314,425
(Increase) decrease in other assets........................................................... (3,107,565) (2,257,798) 158,060
Increase in interest payable ..................................................................... 44,789
56,846 87,005
Increase (decrease) in other liabilities ..................................................... 1,201,973
1,277,833 (913,446)
Net cash provided by operating activities attributable to discontinued
operations ..................................................................................................... 126,384
3,293,456 773,279
Net cash provided by operating activities...................................... 3,482,975
13,010,430 3,376,738
Investing Activities:
Purchases of securities available for sale .................................................................... (21,697,629) (12,717,204) (7,777,082)
Proceeds from maturities of securities available for sale ............................................ 6,676,800
6,026,680 4,289,139
Proceeds from sales of securities available for sale..................................................... 2,627,973
2,307,825 6,891,187
Proceeds from securitizations of loans ........................................................................ 10,046,699
12,641,050 12,343,771
Net increase in loans held for investment.................................................................... (13,588,497) (18,895,193) (19,073,474)
Principal recoveries of loans previously charged off................................................... 669,938
619,678 547,304
Additions of premises and equipment, net .................................................................. (356,327) (437,545) (712,190)
Net payment for companies acquired ..........................................................................
(10,464) (3,635,356)
Net cash provided by investing activities attributable to discontinued operations ...... 11,642
Net cash used in investing activities.............................................. (15,609,401) (10,465,173) (7,126,701)
Financing Activities:
Net increase (decrease) in deposits.............................................................................. 25,859,613
(3,009,716) (24,116)
Net increase (decrease) in other borrowings ............................................................... (11,930,014) 6,624,052 2,215,047
Issuances of senior notes .............................................................................................
1,495,740 3,185,272
Maturities of senior notes............................................................................................ (1,802,395) (462,500) (1,226,882)
Repurchases of senior notes ........................................................................................ (1,120,724) (150,000) (31,296)
Purchases of treasury stock ......................................................................................... (12,501) (3,024,969) (21,615)
Dividends paid ............................................................................................................ (568,255) (42,055) (32,324)
Net proceeds from issuances of common stock........................................................... 772,017
43,493 36,751
Net proceeds from issuance of preferred stock and warrant........................................ 3,555,199
Proceeds from share based payment activities ............................................................ 59,283
301,911 238,355
Net cash used in financing activities attributable to discontinued operations ............. (15,863) (4,280,036)
Net cash provided by (used in) financing activities....................... 14,796,360
(2,274,794) 4,339,192
Increase in cash and cash equivalents.......................................................................... 2,669,934
160,913 589,229
Cash and cash equivalents at beginning of year .......................................................... 4,821,409
4,660,496 4,071,267
Cash and cash equivalents at end of year .................................................................... $ 7,491,343
$ 4,821,409 $ 4,660,496
See Notes to Consolidated Financial Statements.