Capital One 2008 Annual Report Download - page 46
Download and view the complete annual report
Please find page 46 of the 2008 Capital One annual report below. You can navigate through the pages in the report by either clicking on the pages listed below, or by using the keyword search tool below to find specific information within the annual report.-
 1
1 -
2
-
3
-
4
-
5
-
6
-
7
-
8
-
9
-
10
-
11
-
12
-
13
-
14
-
15
-
16
-
17
-
18
-
19
-
20
-
21
-
22
-
23
-
24
-
25
-
26
-
27
-
28
-
29
-
30
-
31
-
32
-
33
-
34
-
35
-
 36
36 -
 37
37 -
 38
38 -
 39
39 -
 40
40 -
 41
41 -
 42
42 -
 43
43 -
 44
44 -
 45
45 -
 46
46 -
 47
47 -
 48
48 -
 49
49 -
 50
50 -
 51
51 -
 52
52 -
 53
53 -
 54
54 -
 55
55 -
 56
56 -
57
-
58
-
59
-
60
-
61
-
62
-
63
-
64
-
65
-
66
-
67
-
68
-
69
-
70
-
71
-
72
-
73
-
74
-
75
-
76
-
77
-
78
-
79
-
80
-
81
-
82
-
83
-
84
-
85
-
86
-
87
-
88
-
89
-
90
-
91
-
92
-
93
-
94
-
95
-
96
-
97
-
98
-
99
-
100
-
101
-
102
-
103
-
104
-
105
-
106
-
107
-
108
-
109
-
110
-
111
-
112
-
113
-
114
-
115
-
116
-
117
-
118
-
119
-
120
-
121
-
122
-
123
-
124
-
125
-
126
-
127
-
128
-
129
-
130
-
131
-
132
-
133
-
134
-
135
-
136
-
137
-
138
-
139
-
140
-
141
-
142
-
143
-
144
-
145
-
146
-
147
-
148
-
149
-
150
-
151
-
152
-
153
-
154
-
155
-
156
-
157
-
158
-
159
-
160
-
161
-
162
-
163
-
164
-
165
-
166
-
167
-
168
-
169
-
170
-
171
-
172
-
173
-
174
-
175
-
176
-
177
-
178
-
179
-
180
-
181
-
182
-
183
-
184
-
185
-
186
 |
 |

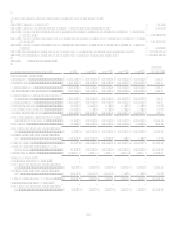
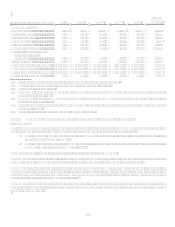
28
(Dollars in millions, Except Per Share Data)
2008
2007 (1)
2006(1)(5)
2005(1)(4)
2004 (1)
Five Year
Compound
Growth Rate
Loss from discontinued operations,
net of tax(6) ....................................... (0.35) (2.58) (0.03) N/A
Net income (loss) per common share...$ (0.21) $ 3.97 $ 7.62 $ 6.73 $ 6.21 (53.16)%
Dividends paid per common share....... 1.50 0.11 0.11 0.11 0.11 N/A
Book value as of year-end.................... 68.38 65.18 61.56 46.97 33.99 (1.27)%
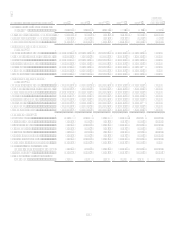
Selected Year-End Reported
Balances(3):
Loans held for investment....................$ 101,017.8 $ 101,805.0 $ 96,512.1 $ 59,847.7 $ 38,215.6 21.46%
Allowance for loan and lease losses .... 4,524.0 2,963.0 2,180.0 1,790.0 1,505.0 24.62%
Total assets........................................... 165,878.4
150,499.1 144,360.8 88,701.4 53,747.3 25.28%
Interest-bearing deposits ...................... 97,326.9 71,714.6 73,913.9 43,092.1 25,636.8 30.58%
Total deposits....................................... 108,620.8
82,761.2 85,562.0 47,933.3 25,636.8(2) 33.48%
Borrowings .......................................... 23,159.9
37,491.2 29,876.8 22,278.1 16,511.8 7.00%
Stockholders equity ............................ 26,612.4
24,294.1 25,235.2 14,128.9 8,388.2 25.97%
Selected Average Reported
Balances(3):
Loans held for investment....................$ 98,970.9 $ 93,541.8 $ 63,577.3 $ 40,734.2 $ 34,265.7 23.63%
Allowance for loan and lease losses .... 3,266.8 2,182.7 1,791.2 1,482.9 1,473.0 17.27%
Average earning assets......................... 133,083.6
121,420.4 84,086.7 55,537.0 46,655.7 23.32%
Total assets........................................... 156,226.4
144,999.1 95,254.7 61,360.5 50,648.1 25.27%
Interest-bearing deposits ...................... 82,735.6 73,764.9 45,592.4 28,370.7 24,313.3 27.75%
Total deposits....................................... 93,507.6
85,211.6 50,526.8 29,019.7 24,313.3(2) 30.92%
Borrowings .......................................... 31,096.5
30,101.5 24,451.7 18,031.9 15,723.6 14.61%
Stockholders equity ............................ 25,277.8
25,203.1 16,203.4 10,594.3 7,295.5 28.21%
Reported Metrics(3):
Revenue margin ................................... 10.44% 12.01% 14.38% 18.08% 19.08% (11.36)%
Net interest margin............................... 5.37 5.38 6.05 6.63 6.44 (3.56)%
Risk adjusted margin............................ 7.83
10.40 12.71 15.47 16.31 (13.66)%
Delinquency rate.................................. 4.37 3.66 2.74 3.14 3.85 2.57%
Net charge-off rate ............................... 3.51 2.10 2.21 3.55 3.78 (1.42)%
Return on average assets...................... 0.05 1.79 2.55 2.95 3.05 (55.35)%
Return on average equity ..................... 0.33 10.28 14.97 17.08 21.16 (56.38)%
Average equity to average assets ......... 16.18 17.38 17.01 17.27 14.40 2.36%
Non-interest expense as a % of
average loans held for investment(7). 7.48
8.64 10.92 14.04 15.53 (13.60)%
Efficiency ratio (7) ................................. 52.29 54.44 57.42 56.96 59.78 (0.56)
Allowance as a % of loans held for
investment ....................................... 4.48 2.91 2.26 2.99 3.94 2.60%