Capital One 2008 Annual Report Download - page 73
Download and view the complete annual report
Please find page 73 of the 2008 Capital One annual report below. You can navigate through the pages in the report by either clicking on the pages listed below, or by using the keyword search tool below to find specific information within the annual report.-
 1
1 -
2
-
3
-
4
-
5
-
6
-
7
-
8
-
9
-
10
-
11
-
12
-
13
-
14
-
15
-
16
-
17
-
18
-
19
-
20
-
21
-
22
-
23
-
24
-
25
-
26
-
27
-
28
-
29
-
30
-
31
-
32
-
33
-
34
-
35
-
36
-
37
-
38
-
39
-
40
-
41
-
42
-
43
-
44
-
45
-
46
-
47
-
48
-
49
-
50
-
51
-
52
-
53
-
54
-
55
-
56
-
57
-
58
-
59
-
60
-
61
-
62
-
 63
63 -
 64
64 -
 65
65 -
 66
66 -
 67
67 -
 68
68 -
 69
69 -
 70
70 -
 71
71 -
 72
72 -
 73
73 -
 74
74 -
 75
75 -
 76
76 -
 77
77 -
 78
78 -
 79
79 -
 80
80 -
 81
81 -
 82
82 -
 83
83 -
84
-
85
-
86
-
87
-
88
-
89
-
90
-
91
-
92
-
93
-
94
-
95
-
96
-
97
-
98
-
99
-
100
-
101
-
102
-
103
-
104
-
105
-
106
-
107
-
108
-
109
-
110
-
111
-
112
-
113
-
114
-
115
-
116
-
117
-
118
-
119
-
120
-
121
-
122
-
123
-
124
-
125
-
126
-
127
-
128
-
129
-
130
-
131
-
132
-
133
-
134
-
135
-
136
-
137
-
138
-
139
-
140
-
141
-
142
-
143
-
144
-
145
-
146
-
147
-
148
-
149
-
150
-
151
-
152
-
153
-
154
-
155
-
156
-
157
-
158
-
159
-
160
-
161
-
162
-
163
-
164
-
165
-
166
-
167
-
168
-
169
-
170
-
171
-
172
-
173
-
174
-
175
-
176
-
177
-
178
-
179
-
180
-
181
-
182
-
183
-
184
-
185
-
186
 |
 |

55
Non-interest expenses were $2.3 billion in 2007, compared to $1.2 billion in 2006. The primary reason for the increase is the addition
of North Fork to the Local Banking segment results in 2007. In addition, during 2007 the Local Banking segment continued to incur
costs associated with the integration of Hibernia and North Fork. These activities progressed as planned during the year and all
Hibernia related integration activities were completed. In 2007, the Company opened 39 new banking locations across Louisiana, New
Jersey, New York, Texas and Virginia. The costs of operating these branches, including lease costs, depreciation and personnel, is
included in non-interest expense.
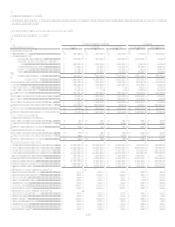
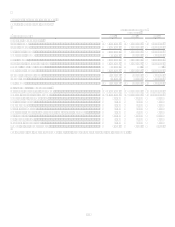
National Lending Segment
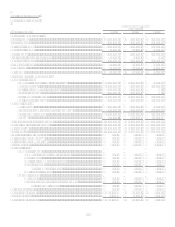
Table 3: National Lending
As of and for the Year Ended
December 31,
(Dollars in thousands)
2008
2007
2006
Earnings (Managed Basis)
Interest income ...............................................................................................
.
$ 13,068,005 $ 13,675,686 $ 12,070,528
Interest expense ..............................................................................................
.
4,077,131 4,834,450 4,174,394
Net interest income.........................................................................................
.
8,990,874 8,841,236 7,896,134
Non-interest income .......................................................................................
.
4,737,612 4,870,727 4,375,126
Total revenue..................................................................................................
.
13,728,486 13,711,963 12,271,260
Provision for loan and lease losses.................................................................
.
7,428,476 4,691,687 3,207,646
Goodwill impairment......................................................................................
.
810,876
Non-interest expense ......................................................................................
.
4,893,898 5,420,204 5,529,104
Income before taxes........................................................................................
.
595,236
3,600,072 3,534,510
Income taxes...................................................................................................
.
485,265
1,237,163 1,240,608
Net income .....................................................................................................
.
$ 109,971
$ 2,362,909 $ 2,293,902
Selected Metrics (Managed Basis)
Period end loans held for investment..............................................................
.
$ 101,147,134 $ 106,508,443 $ 102,359,180
Average loans held for investment .................................................................
.
$ 102,689,253 $ 102,235,384 $ 95,396,391
Total deposits .................................................................................................
.
$ 1,459,131 $ 2,050,861 $ 2,383,902
Loans held for investment yield .....................................................................
.
12.73% 13.38% 12.65%
Net interest margin .........................................................................................
.
8.76% 8.65% 8.28%
Revenue margin..............................................................................................
.
13.37% 13.41% 12.86%
Risk adjusted margin ......................................................................................
.
7.49% 9.45% 9.62%
Non-interest expense as a % of average loans held for investment ................
.
4.77% 5.30% 5.80%
Efficiency ratio ...............................................................................................
.
35.65% 39.53% 45.06%
Net charge-off rate..........................................................................................
.
5.88% 3.96% 3.24%
30+ day delinquency rate................................................................................
.
5.93% 5.17% 4.09%
Number of accounts (000s).............................................................................
.
44,816
48,537 49,373
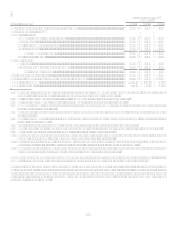
The National Lending segment consists of two sub-segments: U.S. Card and Other National Lending. Other National Lending consists
of Auto Finance and International.
Year Ended December 31, 2008 Compared to Year Ended December 31, 2007
The National Lending segment contributed $110.0 million of net income during 2008, compared to $2.4 billion during 2007. At
December 31, 2008, loans outstanding in the National Lending segment totaled $101.1 billion while deposits outstanding totaled $1.5
billion. Profits are primarily generated from net interest income, which includes past-due fees earned and deemed collectible from our
loans, and non-interest income, which includes fee-based services to customers. The reduction in net income was driven by an
increase in the provision for loan and lease losses of $2.7 billion to $7.4 billion and by the recognition of an impairment on goodwill
of $810.9 million in the Auto Finance sub-segment partially offset by a $526.3 million decrease in non-interest expense due to benefits
from the Companys cost reduction initiatives. The increase in the provision for loan and lease losses was due to a significantly worse
credit environment in 2008 as evidenced by an increase in the net charge-off rate to 5.88% from 3.96% in 2007. Total revenue was flat
compared to 2007 as average managed loans held for investment were essentially level, increasing only 0.44% from 2007 levels, with
growth in U.S. Card offset by declines in both Auto Finance and International. The net interest margin and revenue margin were
8.76% and 13.37%, respectively, during 2008 compared to 8.65% and 13.41%, respectively, during 2007. The risk adjusted margin
decreased to 7.49% from 9.45% in 2007 due to the increase in charge-offs. Accounts have declined by 3.7 million in U.S. Card as the